ADT 2010 Annual Report Download - page 220
Download and view the complete annual report
Please find page 220 of the 2010 ADT annual report below. You can navigate through the pages in the report by either clicking on the pages listed below, or by using the keyword search tool below to find specific information within the annual report.-
 1
1 -
2
-
3
-
4
-
5
-
6
-
7
-
8
-
9
-
10
-
11
-
12
-
13
-
14
-
15
-
16
-
17
-
18
-
19
-
20
-
21
-
22
-
23
-
24
-
25
-
26
-
27
-
28
-
29
-
30
-
31
-
32
-
33
-
34
-
35
-
36
-
37
-
38
-
39
-
40
-
41
-
42
-
43
-
44
-
45
-
46
-
47
-
48
-
49
-
50
-
51
-
52
-
53
-
54
-
55
-
56
-
57
-
58
-
59
-
60
-
61
-
62
-
63
-
64
-
65
-
66
-
67
-
68
-
69
-
70
-
71
-
72
-
73
-
74
-
75
-
76
-
77
-
78
-
79
-
80
-
81
-
82
-
83
-
84
-
85
-
86
-
87
-
88
-
89
-
90
-
91
-
92
-
93
-
94
-
95
-
96
-
97
-
98
-
99
-
100
-
101
-
102
-
103
-
104
-
105
-
106
-
107
-
108
-
109
-
110
-
111
-
112
-
113
-
114
-
115
-
116
-
117
-
118
-
119
-
120
-
121
-
122
-
123
-
124
-
125
-
126
-
127
-
128
-
129
-
130
-
131
-
132
-
133
-
134
-
135
-
136
-
137
-
138
-
139
-
140
-
141
-
142
-
143
-
144
-
145
-
146
-
147
-
148
-
149
-
150
-
151
-
152
-
153
-
154
-
155
-
156
-
157
-
158
-
159
-
160
-
161
-
162
-
163
-
164
-
165
-
166
-
167
-
168
-
169
-
170
-
171
-
172
-
173
-
174
-
175
-
176
-
177
-
178
-
179
-
180
-
181
-
182
-
183
-
184
-
185
-
186
-
187
-
188
-
189
-
190
-
191
-
192
-
193
-
194
-
195
-
196
-
197
-
198
-
199
-
200
-
201
-
202
-
203
-
204
-
205
-
206
-
207
-
208
-
209
-
 210
210 -
 211
211 -
 212
212 -
 213
213 -
 214
214 -
 215
215 -
 216
216 -
 217
217 -
 218
218 -
 219
219 -
 220
220 -
 221
221 -
 222
222 -
 223
223 -
 224
224 -
 225
225 -
 226
226 -
 227
227 -
 228
228 -
 229
229 -
 230
230 -
231
-
232
-
233
-
234
-
235
-
236
-
237
-
238
-
239
-
240
-
241
-
242
-
243
-
244
-
245
-
246
-
247
-
248
-
249
-
250
-
251
-
252
-
253
-
254
-
255
-
256
-
257
-
258
-
259
-
260
-
261
-
262
-
263
-
264
-
265
-
266
-
267
-
268
-
269
-
270
-
271
-
272
-
273
-
274
-
275
-
276
-
277
-
278
-
279
-
280
-
281
-
282
-
283
-
284
-
285
-
286
-
287
-
288
-
289
-
290
-
291
-
292
 |
 |

TYCO INTERNATIONAL LTD.
NOTES TO CONSOLIDATED FINANCIAL STATEMENTS
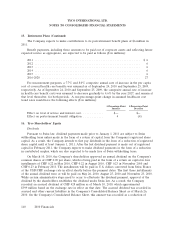
15. Retirement Plans (Continued)
The net periodic benefit cost for all U.S. and non-U.S. defined benefit pension plans for 2010,
2009 and 2008 is as follows ($ in millions):
U.S. Plans Non-U.S. Plans
2010 2009 2008 2010 2009 2008
Service cost .................................. $ 10 $ 9 $ 8 $ 23 $ 28 $ 45
Interest cost .................................. 46 49 47 71 68 81
Expected return on plan assets .................... (49) (49) (58) (67) (60) (82)
Amortization of initial net asset ...................————— (1)
Amortization of prior service cost (credit) ............111(2)(3)(3)
Amortization of net actuarial loss .................. 26 9 5 26 15 19
Plan settlements, curtailments and special termination
benefits ................................... 1 — — (29) (1) (2)
Net periodic benefit cost ....................... $ 35 $ 19 $ 3 $ 22 $ 47 $ 57
Weighted-average assumptions used to determine net periodic
pension cost during the year:
Discount rate ................................. 5.5% 7.6% 6.3% 5.6% 6.5% 5.6%
Expected return on plan assets .................... 8.0% 8.0% 8.0% 7.0% 7.0% 7.1%
Rate of compensation increase .................... 4.0% 4.0% 4.0% 4.2% 4.5% 4.4%
During the third quarter of 2010, the Company adopted plan amendments that froze pension plan
benefits for certain of its defined benefit arrangements in the United Kingdom, which resulted in the
Company recognizing a curtailment gain of approximately $22 million in selling, general and
administrative expenses within the Consolidated Statement of Operations. For inactive plans the
Company will amortize its actuarial gains and losses over the average remaining life expectancy of the
pension plan participants.
The estimated net loss and prior service cost for U.S. pension benefit plans that will be amortized
from accumulated other comprehensive loss into net periodic benefit cost over the next fiscal year are
expected to be $12 million and $1 million, respectively.
The estimated net loss and prior service credit for non-U.S. pension benefit plans that will be
amortized from accumulated other comprehensive loss into net periodic benefit cost over the next fiscal
year are expected to be $12 million and nil, respectively.
132 2010 Financials