ADT 2010 Annual Report Download - page 140
Download and view the complete annual report
Please find page 140 of the 2010 ADT annual report below. You can navigate through the pages in the report by either clicking on the pages listed below, or by using the keyword search tool below to find specific information within the annual report.-
 1
1 -
2
-
3
-
4
-
5
-
6
-
7
-
8
-
9
-
10
-
11
-
12
-
13
-
14
-
15
-
16
-
17
-
18
-
19
-
20
-
21
-
22
-
23
-
24
-
25
-
26
-
27
-
28
-
29
-
30
-
31
-
32
-
33
-
34
-
35
-
36
-
37
-
38
-
39
-
40
-
41
-
42
-
43
-
44
-
45
-
46
-
47
-
48
-
49
-
50
-
51
-
52
-
53
-
54
-
55
-
56
-
57
-
58
-
59
-
60
-
61
-
62
-
63
-
64
-
65
-
66
-
67
-
68
-
69
-
70
-
71
-
72
-
73
-
74
-
75
-
76
-
77
-
78
-
79
-
80
-
81
-
82
-
83
-
84
-
85
-
86
-
87
-
88
-
89
-
90
-
91
-
92
-
93
-
94
-
95
-
96
-
97
-
98
-
99
-
100
-
101
-
102
-
103
-
104
-
105
-
106
-
107
-
108
-
109
-
110
-
111
-
112
-
113
-
114
-
115
-
116
-
117
-
118
-
119
-
120
-
121
-
122
-
123
-
124
-
125
-
126
-
127
-
128
-
129
-
 130
130 -
 131
131 -
 132
132 -
 133
133 -
 134
134 -
 135
135 -
 136
136 -
 137
137 -
 138
138 -
 139
139 -
 140
140 -
 141
141 -
 142
142 -
 143
143 -
 144
144 -
 145
145 -
 146
146 -
 147
147 -
 148
148 -
 149
149 -
 150
150 -
151
-
152
-
153
-
154
-
155
-
156
-
157
-
158
-
159
-
160
-
161
-
162
-
163
-
164
-
165
-
166
-
167
-
168
-
169
-
170
-
171
-
172
-
173
-
174
-
175
-
176
-
177
-
178
-
179
-
180
-
181
-
182
-
183
-
184
-
185
-
186
-
187
-
188
-
189
-
190
-
191
-
192
-
193
-
194
-
195
-
196
-
197
-
198
-
199
-
200
-
201
-
202
-
203
-
204
-
205
-
206
-
207
-
208
-
209
-
210
-
211
-
212
-
213
-
214
-
215
-
216
-
217
-
218
-
219
-
220
-
221
-
222
-
223
-
224
-
225
-
226
-
227
-
228
-
229
-
230
-
231
-
232
-
233
-
234
-
235
-
236
-
237
-
238
-
239
-
240
-
241
-
242
-
243
-
244
-
245
-
246
-
247
-
248
-
249
-
250
-
251
-
252
-
253
-
254
-
255
-
256
-
257
-
258
-
259
-
260
-
261
-
262
-
263
-
264
-
265
-
266
-
267
-
268
-
269
-
270
-
271
-
272
-
273
-
274
-
275
-
276
-
277
-
278
-
279
-
280
-
281
-
282
-
283
-
284
-
285
-
286
-
287
-
288
-
289
-
290
-
291
-
292
 |
 |
world. The primary source of funds to finance our operations and capital expenditures is cash
generated by operations. In addition, we maintain a commercial paper program, have access to
committed revolving credit lines and have access to equity and debt capital from public and private
sources. We continue to balance our operating, investing and financing uses of cash through investment
in our core businesses, strategic acquisitions and divestitures, dividends and share repurchases. We
believe our cash position, amounts available under our credit facilities and cash provided by operating
activities will be adequate to cover our operational and business needs.
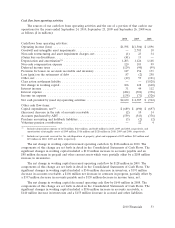
We had $1.8 billion and $2.4 billion of cash and cash equivalents as of September 24, 2010 and
September 25, 2009, respectively. Cash generated by operating activities increased to $2.6 billion for the
2010 fiscal year compared to $2.4 billion in fiscal 2009. Cash used in investing activities was $1.8 billion
for the 2010 fiscal year compared to $1.3 billion in fiscal 2009. Cash used in financing activities was
$1.4 billion for the 2010 fiscal year compared to $0.3 billion in fiscal 2009.
As of September 24, 2010, our shareholder’s equity was $14.1 billion and our total debt was
$4.2 billion. In addition, we had lines of credit totaling approximately $1.7 billion, none of which were
drawn. Our ratio of total debt to total capital (the sum of our short- and long-term debt and
shareholders’ equity) was 23% at September 24, 2010 and 25% at September 25, 2009. This ratio is a
measure of our long-term liquidity and is an indicator of financial flexibility.
We continue to monitor market conditions and assess the impact, if any, on our financial position,
results of operations and cash flows. More than 95% of our U.S. and non-U.S. funded pension plans
are invested in marketable investments, including publicly-traded equity and fixed income securities.
Our funding policy is to make contributions in accordance with the laws and customs of the various
countries in which we operate as well as to make discretionary contributions from time to time. We
anticipate that we will contribute at least the minimum required to our pension plans in 2011 of
$12 million for the U.S. plans and $52 million for non-U.S. plans. We also anticipate making
discretionary contributions of approximately $20 million to our U.S. plans during 2011.
52 2010 Financials