ADT 2010 Annual Report Download - page 201
Download and view the complete annual report
Please find page 201 of the 2010 ADT annual report below. You can navigate through the pages in the report by either clicking on the pages listed below, or by using the keyword search tool below to find specific information within the annual report.-
 1
1 -
2
-
3
-
4
-
5
-
6
-
7
-
8
-
9
-
10
-
11
-
12
-
13
-
14
-
15
-
16
-
17
-
18
-
19
-
20
-
21
-
22
-
23
-
24
-
25
-
26
-
27
-
28
-
29
-
30
-
31
-
32
-
33
-
34
-
35
-
36
-
37
-
38
-
39
-
40
-
41
-
42
-
43
-
44
-
45
-
46
-
47
-
48
-
49
-
50
-
51
-
52
-
53
-
54
-
55
-
56
-
57
-
58
-
59
-
60
-
61
-
62
-
63
-
64
-
65
-
66
-
67
-
68
-
69
-
70
-
71
-
72
-
73
-
74
-
75
-
76
-
77
-
78
-
79
-
80
-
81
-
82
-
83
-
84
-
85
-
86
-
87
-
88
-
89
-
90
-
91
-
92
-
93
-
94
-
95
-
96
-
97
-
98
-
99
-
100
-
101
-
102
-
103
-
104
-
105
-
106
-
107
-
108
-
109
-
110
-
111
-
112
-
113
-
114
-
115
-
116
-
117
-
118
-
119
-
120
-
121
-
122
-
123
-
124
-
125
-
126
-
127
-
128
-
129
-
130
-
131
-
132
-
133
-
134
-
135
-
136
-
137
-
138
-
139
-
140
-
141
-
142
-
143
-
144
-
145
-
146
-
147
-
148
-
149
-
150
-
151
-
152
-
153
-
154
-
155
-
156
-
157
-
158
-
159
-
160
-
161
-
162
-
163
-
164
-
165
-
166
-
167
-
168
-
169
-
170
-
171
-
172
-
173
-
174
-
175
-
176
-
177
-
178
-
179
-
180
-
181
-
182
-
183
-
184
-
185
-
186
-
187
-
188
-
189
-
190
-
 191
191 -
 192
192 -
 193
193 -
 194
194 -
 195
195 -
 196
196 -
 197
197 -
 198
198 -
 199
199 -
 200
200 -
 201
201 -
 202
202 -
 203
203 -
 204
204 -
 205
205 -
 206
206 -
 207
207 -
 208
208 -
 209
209 -
 210
210 -
 211
211 -
212
-
213
-
214
-
215
-
216
-
217
-
218
-
219
-
220
-
221
-
222
-
223
-
224
-
225
-
226
-
227
-
228
-
229
-
230
-
231
-
232
-
233
-
234
-
235
-
236
-
237
-
238
-
239
-
240
-
241
-
242
-
243
-
244
-
245
-
246
-
247
-
248
-
249
-
250
-
251
-
252
-
253
-
254
-
255
-
256
-
257
-
258
-
259
-
260
-
261
-
262
-
263
-
264
-
265
-
266
-
267
-
268
-
269
-
270
-
271
-
272
-
273
-
274
-
275
-
276
-
277
-
278
-
279
-
280
-
281
-
282
-
283
-
284
-
285
-
286
-
287
-
288
-
289
-
290
-
291
-
292
 |
 |

TYCO INTERNATIONAL LTD.
NOTES TO CONSOLIDATED FINANCIAL STATEMENTS
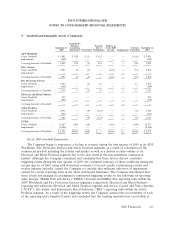
9. Goodwill and Intangible Assets (Continued)
2009. Specifically, the Company recorded the following non-cash goodwill impairment charges at the
following reporting units ($ in millions):
Pre-tax After-tax
Reporting Unit Charge Charge
EMEA Fire ............................................... $ 180 $ 179
EMEA Security ............................................ 613 610
Electrical and Metal Products .................................. 935 915
ACVS................................................... 327 321
Life Safety ................................................ 240 236
SRS .................................................... 346 340
Total .................................................... $2,641 $2,601
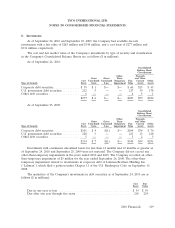
During the annual goodwill impairment testing for the fiscal year ended September 26, 2008, the
carrying amount of goodwill in the Latin America Fire Protection business, part of the Fire Protection
Services segment, exceeded the implied fair value of goodwill. As a result, the Company recognized a
goodwill impairment of $9 million in the fourth quarter of 2008.
Intangible Assets
Indefinite lived intangible assets consisting primarily of trade names are tested for impairment
using the relief from royalty method. There were no indefinite lived intangible asset impairments as a
result of performing the company’s 2010 annual impairment test.
The following table sets forth the gross carrying amount and accumulated amortization of the
Company’s intangible assets as of September 24, 2010 and September 25, 2009 ($ in millions):
September 24, 2010 September 25, 2009
Gross Weighted Average Gross Weighted Average
Carrying Accumulated Amortization Carrying Accumulated Amortization
Amount Amortization Period Amount Amortization Period
Amortizable:
Contracts and related
customer relationships .... $7,664 $4,606 14 years $6,529 $4,275 14 years
Intellectual property ....... 546 477 20 years 545 459 18 years
Other .................. 29 15 8 years 17 13 10 years
Total .................... $8,239 $5,098 14 years $7,091 $4,747 14 years
Non-Amortizable:
Intellectual property ....... $ 213 $ 212
Other .................. 92 87
Total .................... $ 305 $ 299
Intangible asset amortization expense for 2010, 2009 and 2008 was $549 million, $516 million and
$528 million, respectively.
2010 Financials 113