ADT 2010 Annual Report Download - page 232
Download and view the complete annual report
Please find page 232 of the 2010 ADT annual report below. You can navigate through the pages in the report by either clicking on the pages listed below, or by using the keyword search tool below to find specific information within the annual report.-
 1
1 -
2
-
3
-
4
-
5
-
6
-
7
-
8
-
9
-
10
-
11
-
12
-
13
-
14
-
15
-
16
-
17
-
18
-
19
-
20
-
21
-
22
-
23
-
24
-
25
-
26
-
27
-
28
-
29
-
30
-
31
-
32
-
33
-
34
-
35
-
36
-
37
-
38
-
39
-
40
-
41
-
42
-
43
-
44
-
45
-
46
-
47
-
48
-
49
-
50
-
51
-
52
-
53
-
54
-
55
-
56
-
57
-
58
-
59
-
60
-
61
-
62
-
63
-
64
-
65
-
66
-
67
-
68
-
69
-
70
-
71
-
72
-
73
-
74
-
75
-
76
-
77
-
78
-
79
-
80
-
81
-
82
-
83
-
84
-
85
-
86
-
87
-
88
-
89
-
90
-
91
-
92
-
93
-
94
-
95
-
96
-
97
-
98
-
99
-
100
-
101
-
102
-
103
-
104
-
105
-
106
-
107
-
108
-
109
-
110
-
111
-
112
-
113
-
114
-
115
-
116
-
117
-
118
-
119
-
120
-
121
-
122
-
123
-
124
-
125
-
126
-
127
-
128
-
129
-
130
-
131
-
132
-
133
-
134
-
135
-
136
-
137
-
138
-
139
-
140
-
141
-
142
-
143
-
144
-
145
-
146
-
147
-
148
-
149
-
150
-
151
-
152
-
153
-
154
-
155
-
156
-
157
-
158
-
159
-
160
-
161
-
162
-
163
-
164
-
165
-
166
-
167
-
168
-
169
-
170
-
171
-
172
-
173
-
174
-
175
-
176
-
177
-
178
-
179
-
180
-
181
-
182
-
183
-
184
-
185
-
186
-
187
-
188
-
189
-
190
-
191
-
192
-
193
-
194
-
195
-
196
-
197
-
198
-
199
-
200
-
201
-
202
-
203
-
204
-
205
-
206
-
207
-
208
-
209
-
210
-
211
-
212
-
213
-
214
-
215
-
216
-
217
-
218
-
219
-
220
-
221
-
 222
222 -
 223
223 -
 224
224 -
 225
225 -
 226
226 -
 227
227 -
 228
228 -
 229
229 -
 230
230 -
 231
231 -
 232
232 -
 233
233 -
 234
234 -
 235
235 -
 236
236 -
 237
237 -
 238
238 -
 239
239 -
 240
240 -
 241
241 -
 242
242 -
243
-
244
-
245
-
246
-
247
-
248
-
249
-
250
-
251
-
252
-
253
-
254
-
255
-
256
-
257
-
258
-
259
-
260
-
261
-
262
-
263
-
264
-
265
-
266
-
267
-
268
-
269
-
270
-
271
-
272
-
273
-
274
-
275
-
276
-
277
-
278
-
279
-
280
-
281
-
282
-
283
-
284
-
285
-
286
-
287
-
288
-
289
-
290
-
291
-
292
 |
 |

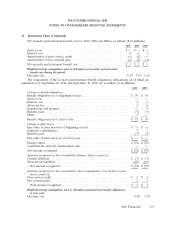
TYCO INTERNATIONAL LTD.
NOTES TO CONSOLIDATED FINANCIAL STATEMENTS
17. Share Plans (Continued)
life is based on the contractual term of the option and expected employee exercise and post-vesting
employment termination behavior. The risk-free interest rate is based on U.S. Treasury zero-coupon
issues with a remaining term equal to the expected life assumed at the date of grant. The compensation
expense recognized is net of estimated forfeitures. Forfeitures are estimated based on voluntary
termination behavior, as well as an analysis of actual share option forfeitures. The weighted-average
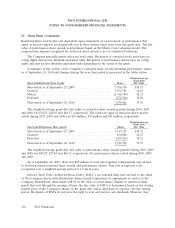
assumptions used in the Black-Scholes option pricing model for 2010, 2009 and 2008 are as follows:
2010 2009 2008
Expected stock price volatility ............................ 34% 32% 27%
Risk free interest rate .................................. 2.50% 2.67% 2.93%
Expected annual dividend per share ........................ $0.80 $0.80 $0.62
Expected life of options (years) ........................... 5.5 5.2 4.5
The weighted-average grant-date fair values of options granted during 2010, 2009 and 2008 was
$9.18, $7.09 and $11.06, respectively. The total intrinsic value of options exercised during 2010, 2009
and 2008 was $32 million, $0.5 million and $16 million, respectively. The related excess cash tax benefit
classified as a financing cash inflow for 2010, 2009 and 2008 was not significant.
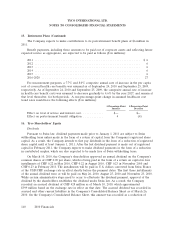
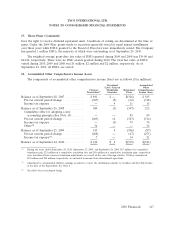
A summary of the option activity as of September 24, 2010 and changes during the year then
ended is presented below:
Weighted-
Average Aggregate
Weighted- Remaining Intrinsic
Average Contractual Term Value
Shares Exercise Price (in years) ($ in millions)
Outstanding as of September 25, 2009 ..... 25,692,746 $45.22
Granted ........................... 4,173,880 33.82
Replacement awards (see Note 4) ......... 1,682,437 23.76
Exercised .......................... (2,104,474) 23.12
Expired ............................ (2,370,193) 63.69
Forfeited ........................... (675,007) 36.15
Outstanding as of September 24, 2010 ..... 26,399,389 42.38 5.5 $123
Vested and unvested expected to vest as of
September 24, 2010 ................. 25,658,044 42.66 5.4 118
Exercisable as of September 24, 2010 ...... 17,337,611 46.67 4.0 68
As of September 24, 2010, there was $47 million of total unrecognized compensation cost related
to non-vested options granted. The cost is expected to be recognized over a weighted-average period of
2.2 fiscal years.
Employee Stock Purchase Plans—Substantially all full-time employees of the Company’s U.S.
subsidiaries and employees of certain qualified non-U.S. subsidiaries were eligible to participate in an
employee share purchase plan (‘‘ESPP’’). Eligible employees authorized payroll deductions to be made
for the purchase of shares. The Company matched a portion of the employee contribution by
contributing an additional 15% of the employee’s payroll deduction. All shares purchased under the
plan were purchased on the open market by a designated broker. The ESPP was suspended indefinitely
during the quarter ended September 25, 2009.
144 2010 Financials