ADT 2010 Annual Report Download - page 238
Download and view the complete annual report
Please find page 238 of the 2010 ADT annual report below. You can navigate through the pages in the report by either clicking on the pages listed below, or by using the keyword search tool below to find specific information within the annual report.-
 1
1 -
2
-
3
-
4
-
5
-
6
-
7
-
8
-
9
-
10
-
11
-
12
-
13
-
14
-
15
-
16
-
17
-
18
-
19
-
20
-
21
-
22
-
23
-
24
-
25
-
26
-
27
-
28
-
29
-
30
-
31
-
32
-
33
-
34
-
35
-
36
-
37
-
38
-
39
-
40
-
41
-
42
-
43
-
44
-
45
-
46
-
47
-
48
-
49
-
50
-
51
-
52
-
53
-
54
-
55
-
56
-
57
-
58
-
59
-
60
-
61
-
62
-
63
-
64
-
65
-
66
-
67
-
68
-
69
-
70
-
71
-
72
-
73
-
74
-
75
-
76
-
77
-
78
-
79
-
80
-
81
-
82
-
83
-
84
-
85
-
86
-
87
-
88
-
89
-
90
-
91
-
92
-
93
-
94
-
95
-
96
-
97
-
98
-
99
-
100
-
101
-
102
-
103
-
104
-
105
-
106
-
107
-
108
-
109
-
110
-
111
-
112
-
113
-
114
-
115
-
116
-
117
-
118
-
119
-
120
-
121
-
122
-
123
-
124
-
125
-
126
-
127
-
128
-
129
-
130
-
131
-
132
-
133
-
134
-
135
-
136
-
137
-
138
-
139
-
140
-
141
-
142
-
143
-
144
-
145
-
146
-
147
-
148
-
149
-
150
-
151
-
152
-
153
-
154
-
155
-
156
-
157
-
158
-
159
-
160
-
161
-
162
-
163
-
164
-
165
-
166
-
167
-
168
-
169
-
170
-
171
-
172
-
173
-
174
-
175
-
176
-
177
-
178
-
179
-
180
-
181
-
182
-
183
-
184
-
185
-
186
-
187
-
188
-
189
-
190
-
191
-
192
-
193
-
194
-
195
-
196
-
197
-
198
-
199
-
200
-
201
-
202
-
203
-
204
-
205
-
206
-
207
-
208
-
209
-
210
-
211
-
212
-
213
-
214
-
215
-
216
-
217
-
218
-
219
-
220
-
221
-
222
-
223
-
224
-
225
-
226
-
227
-
 228
228 -
 229
229 -
 230
230 -
 231
231 -
 232
232 -
 233
233 -
 234
234 -
 235
235 -
 236
236 -
 237
237 -
 238
238 -
 239
239 -
 240
240 -
 241
241 -
 242
242 -
 243
243 -
 244
244 -
 245
245 -
 246
246 -
 247
247 -
 248
248 -
249
-
250
-
251
-
252
-
253
-
254
-
255
-
256
-
257
-
258
-
259
-
260
-
261
-
262
-
263
-
264
-
265
-
266
-
267
-
268
-
269
-
270
-
271
-
272
-
273
-
274
-
275
-
276
-
277
-
278
-
279
-
280
-
281
-
282
-
283
-
284
-
285
-
286
-
287
-
288
-
289
-
290
-
291
-
292
 |
 |

TYCO INTERNATIONAL LTD.
NOTES TO CONSOLIDATED FINANCIAL STATEMENTS
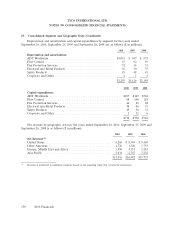
19. Consolidated Segment and Geographic Data (Continued)
Depreciation and amortization and capital expenditures by segment for the years ended
September 24, 2010, September 25, 2009 and September 26, 2008 are as follows ($ in millions):
2010 2009 2008
Depreciation and amortization:
ADT Worldwide ..................................... $1,019 $ 947 $ 975
Flow Control ........................................ 67 62 59
Fire Protection Services ................................ 32 34 31
Electrical and Metal Products ............................ 36 30 37
Safety Products ...................................... 45 48 43
Corporate and Other ..................................453
$1,203 $1,126 $1,148
2010 2009 2008
Capital expenditures
ADT Worldwide ......................................... $497 $443 $504
Flow Control ........................................... 98 100 118
Fire Protection Services .................................... 24 25 28
Electrical and Metal Products ............................... 48 46 35
Safety Products .......................................... 49 56 31
Corporate and Other ...................................... 2 32 6
$718 $702 $722
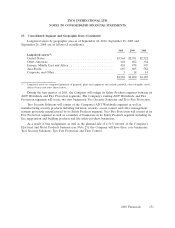
Net revenue by geographic area for the years ended September 24, 2010, September 25, 2009 and
September 26, 2008 is as follows ($ in millions):
2010 2009 2008
Net Revenue(1):
United States ..................................... 8,266 $ 8,304 $ 9,465
Other Americas ................................... 1,726 1,520 1,733
Europe, Middle East and Africa ....................... 3,990 4,351 5,283
Asia-Pacific ...................................... 3,034 2,707 3,252
$17,016 $16,882 $19,733
(1) Revenue is attributed to individual countries based on the reporting entity that records the transaction.
150 2010 Financials