ADT 2010 Annual Report Download - page 163
Download and view the complete annual report
Please find page 163 of the 2010 ADT annual report below. You can navigate through the pages in the report by either clicking on the pages listed below, or by using the keyword search tool below to find specific information within the annual report.-
 1
1 -
2
-
3
-
4
-
5
-
6
-
7
-
8
-
9
-
10
-
11
-
12
-
13
-
14
-
15
-
16
-
17
-
18
-
19
-
20
-
21
-
22
-
23
-
24
-
25
-
26
-
27
-
28
-
29
-
30
-
31
-
32
-
33
-
34
-
35
-
36
-
37
-
38
-
39
-
40
-
41
-
42
-
43
-
44
-
45
-
46
-
47
-
48
-
49
-
50
-
51
-
52
-
53
-
54
-
55
-
56
-
57
-
58
-
59
-
60
-
61
-
62
-
63
-
64
-
65
-
66
-
67
-
68
-
69
-
70
-
71
-
72
-
73
-
74
-
75
-
76
-
77
-
78
-
79
-
80
-
81
-
82
-
83
-
84
-
85
-
86
-
87
-
88
-
89
-
90
-
91
-
92
-
93
-
94
-
95
-
96
-
97
-
98
-
99
-
100
-
101
-
102
-
103
-
104
-
105
-
106
-
107
-
108
-
109
-
110
-
111
-
112
-
113
-
114
-
115
-
116
-
117
-
118
-
119
-
120
-
121
-
122
-
123
-
124
-
125
-
126
-
127
-
128
-
129
-
130
-
131
-
132
-
133
-
134
-
135
-
136
-
137
-
138
-
139
-
140
-
141
-
142
-
143
-
144
-
145
-
146
-
147
-
148
-
149
-
150
-
151
-
152
-
 153
153 -
 154
154 -
 155
155 -
 156
156 -
 157
157 -
 158
158 -
 159
159 -
 160
160 -
 161
161 -
 162
162 -
 163
163 -
 164
164 -
 165
165 -
 166
166 -
 167
167 -
 168
168 -
 169
169 -
 170
170 -
 171
171 -
 172
172 -
 173
173 -
174
-
175
-
176
-
177
-
178
-
179
-
180
-
181
-
182
-
183
-
184
-
185
-
186
-
187
-
188
-
189
-
190
-
191
-
192
-
193
-
194
-
195
-
196
-
197
-
198
-
199
-
200
-
201
-
202
-
203
-
204
-
205
-
206
-
207
-
208
-
209
-
210
-
211
-
212
-
213
-
214
-
215
-
216
-
217
-
218
-
219
-
220
-
221
-
222
-
223
-
224
-
225
-
226
-
227
-
228
-
229
-
230
-
231
-
232
-
233
-
234
-
235
-
236
-
237
-
238
-
239
-
240
-
241
-
242
-
243
-
244
-
245
-
246
-
247
-
248
-
249
-
250
-
251
-
252
-
253
-
254
-
255
-
256
-
257
-
258
-
259
-
260
-
261
-
262
-
263
-
264
-
265
-
266
-
267
-
268
-
269
-
270
-
271
-
272
-
273
-
274
-
275
-
276
-
277
-
278
-
279
-
280
-
281
-
282
-
283
-
284
-
285
-
286
-
287
-
288
-
289
-
290
-
291
-
292
 |
 |

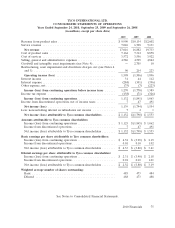
TYCO INTERNATIONAL LTD.
CONSOLIDATED STATEMENTS OF OPERATIONS
Years Ended September 24, 2010, September 25, 2009 and September 26, 2008
(in millions, except per share data)
2010 2009 2008
Revenue from product sales ................................. $ 9,990 $10,134 $12,602
Service revenue .......................................... 7,026 6,748 7,131
Net revenue ........................................... 17,016 16,882 19,733
Cost of product sales ...................................... 7,164 7,314 8,858
Cost of services .......................................... 3,572 3,556 3,922
Selling, general and administrative expenses ...................... 4,586 4,599 4,824
Goodwill and intangible asset impairments (see Note 9) ............. — 2,705 10
Restructuring, asset impairment and divestiture charges, net (see Notes 2
and 3) ............................................... 96 214 223
Operating income (loss) .................................. 1,598 (1,506) 1,896
Interest income .......................................... 31 44 112
Interest expense .......................................... (284) (301) (396)
Other expense, net ........................................ (75) (7) (223)
Income (loss) from continuing operations before income taxes ...... 1,270 (1,770) 1,389
Income tax expense ....................................... (138) (71) (326)
Income (loss) from continuing operations ..................... 1,132 (1,841) 1,063
Income from discontinued operations, net of income taxes ........... 7 47 491
Net income (loss) ....................................... 1,139 (1,794) 1,554
Less: noncontrolling interest in subsidiaries net income .............741
Net income (loss) attributable to Tyco common shareholders ........ $ 1,132 $(1,798) $ 1,553
Amounts attributable to Tyco common shareholders:
Income (loss) from continuing operations ...................... $ 1,125 $(1,845) $ 1,062
Income from discontinued operations ......................... 7 47 491
Net income (loss) attributable to Tyco common shareholders ........ $ 1,132 $ (1,798) $ 1,553
Basic earnings per share attributable to Tyco common shareholders:
Income (loss) from continuing operations ...................... $ 2.32 $ (3.90) $ 2.19
Income from discontinued operations ......................... 0.01 0.10 1.02
Net income (loss) attributable to Tyco common shareholders ........ $ 2.33 $ (3.80) $ 3.21
Diluted earnings per share attributable to Tyco common shareholders:
Income (loss) from continuing operations ...................... $ 2.31 $ (3.90) $ 2.18
Income from discontinued operations ......................... 0.01 0.10 1.01
Net income (loss) attributable to Tyco common shareholders ........ $ 2.32 $ (3.80) $ 3.19
Weighted average number of shares outstanding:
Basic ................................................ 485 473 484
Diluted .............................................. 488 473 488
See Notes to Consolidated Financial Statements.
2010 Financials 75