ADT 2010 Annual Report Download - page 222
Download and view the complete annual report
Please find page 222 of the 2010 ADT annual report below. You can navigate through the pages in the report by either clicking on the pages listed below, or by using the keyword search tool below to find specific information within the annual report.-
 1
1 -
2
-
3
-
4
-
5
-
6
-
7
-
8
-
9
-
10
-
11
-
12
-
13
-
14
-
15
-
16
-
17
-
18
-
19
-
20
-
21
-
22
-
23
-
24
-
25
-
26
-
27
-
28
-
29
-
30
-
31
-
32
-
33
-
34
-
35
-
36
-
37
-
38
-
39
-
40
-
41
-
42
-
43
-
44
-
45
-
46
-
47
-
48
-
49
-
50
-
51
-
52
-
53
-
54
-
55
-
56
-
57
-
58
-
59
-
60
-
61
-
62
-
63
-
64
-
65
-
66
-
67
-
68
-
69
-
70
-
71
-
72
-
73
-
74
-
75
-
76
-
77
-
78
-
79
-
80
-
81
-
82
-
83
-
84
-
85
-
86
-
87
-
88
-
89
-
90
-
91
-
92
-
93
-
94
-
95
-
96
-
97
-
98
-
99
-
100
-
101
-
102
-
103
-
104
-
105
-
106
-
107
-
108
-
109
-
110
-
111
-
112
-
113
-
114
-
115
-
116
-
117
-
118
-
119
-
120
-
121
-
122
-
123
-
124
-
125
-
126
-
127
-
128
-
129
-
130
-
131
-
132
-
133
-
134
-
135
-
136
-
137
-
138
-
139
-
140
-
141
-
142
-
143
-
144
-
145
-
146
-
147
-
148
-
149
-
150
-
151
-
152
-
153
-
154
-
155
-
156
-
157
-
158
-
159
-
160
-
161
-
162
-
163
-
164
-
165
-
166
-
167
-
168
-
169
-
170
-
171
-
172
-
173
-
174
-
175
-
176
-
177
-
178
-
179
-
180
-
181
-
182
-
183
-
184
-
185
-
186
-
187
-
188
-
189
-
190
-
191
-
192
-
193
-
194
-
195
-
196
-
197
-
198
-
199
-
200
-
201
-
202
-
203
-
204
-
205
-
206
-
207
-
208
-
209
-
210
-
211
-
 212
212 -
 213
213 -
 214
214 -
 215
215 -
 216
216 -
 217
217 -
 218
218 -
 219
219 -
 220
220 -
 221
221 -
 222
222 -
 223
223 -
 224
224 -
 225
225 -
 226
226 -
 227
227 -
 228
228 -
 229
229 -
 230
230 -
 231
231 -
 232
232 -
233
-
234
-
235
-
236
-
237
-
238
-
239
-
240
-
241
-
242
-
243
-
244
-
245
-
246
-
247
-
248
-
249
-
250
-
251
-
252
-
253
-
254
-
255
-
256
-
257
-
258
-
259
-
260
-
261
-
262
-
263
-
264
-
265
-
266
-
267
-
268
-
269
-
270
-
271
-
272
-
273
-
274
-
275
-
276
-
277
-
278
-
279
-
280
-
281
-
282
-
283
-
284
-
285
-
286
-
287
-
288
-
289
-
290
-
291
-
292
 |
 |

TYCO INTERNATIONAL LTD.
NOTES TO CONSOLIDATED FINANCIAL STATEMENTS
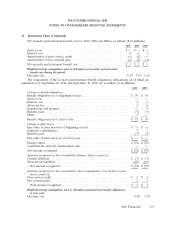
15. Retirement Plans (Continued)
tax benefit of $2 million, and a net increase to accumulated other comprehensive income (loss) of
$61 million, net of income taxes of $28 million.
U.S. Plans Non-U.S. Plans
2010 2009 2010 2009
Amounts recognized in the Consolidated Balance Sheets consist of:
Non-current assets ...................................... $ — $ — $ 2 $ 6
Current liabilities ....................................... (3) (3) (13) (11)
Non-current liabilities .................................... (270) (229) (347) (375)
Net amount recognized ................................. $(273) $(232) $(358) $(380)
Amounts recognized in accumulated other comprehensive loss (before
income taxes) consist of:
Transition asset ......................................... $ — $ — $ 3 $ 4
Prior service (cost) credit ................................. (6) (7) (1) 26
Net actuarial loss ....................................... (374) (363) (426) (420)
Total loss recognized ................................... $(380) $(370) $(424) $(390)
Weighted-average assumptions used to determine pension benefit obligations
at year end:
Discount rate .......................................... 5.0% 5.5% 5.0% 5.6%
Rate of compensation increase ............................. 4.0% 4.0% 3.5% 4.2%
The accumulated benefit obligation for all U.S. plans as of September 24, 2010 and September 25,
2009 was $929 million and $862 million, respectively. The accumulated benefit obligation for all non-
U.S. plans as of September 24, 2010 and September 25, 2009 was $1,366 million and $1,276 million,
respectively.
The accumulated benefit obligation and fair value of plan assets for U.S. pension plans with
accumulated benefit obligations in excess of plan assets were $929 million and $657 million,
respectively, as of September 24, 2010 and $862 million and $631 million, respectively, as of
September 25, 2009.
The accumulated benefit obligation and fair value of plan assets for non-U.S. pension plans with
accumulated benefit obligations in excess of plan assets were $1,344 million and $1,006 million,
respectively, as of September 24, 2010 and $1,253 million and $919 million, respectively, as of
September 25, 2009.
The aggregate benefit obligation and fair value of plan assets for U.S. pension plans with benefit
obligations in excess of plan assets were $930 million and $657 million, respectively, as of
September 24, 2010 and $863 million and $631 million, respectively, as of September 25, 2009.
The aggregate benefit obligation and fair value of plan assets for non-U.S. pension plans with
benefit obligations in excess of plan assets were $1,365 million and $1,006 million, respectively, as of
September 24, 2010 and $1,312 million and $927 million, respectively, as of September 25, 2009.
134 2010 Financials