ADT 2010 Annual Report Download - page 230
Download and view the complete annual report
Please find page 230 of the 2010 ADT annual report below. You can navigate through the pages in the report by either clicking on the pages listed below, or by using the keyword search tool below to find specific information within the annual report.-
 1
1 -
2
-
3
-
4
-
5
-
6
-
7
-
8
-
9
-
10
-
11
-
12
-
13
-
14
-
15
-
16
-
17
-
18
-
19
-
20
-
21
-
22
-
23
-
24
-
25
-
26
-
27
-
28
-
29
-
30
-
31
-
32
-
33
-
34
-
35
-
36
-
37
-
38
-
39
-
40
-
41
-
42
-
43
-
44
-
45
-
46
-
47
-
48
-
49
-
50
-
51
-
52
-
53
-
54
-
55
-
56
-
57
-
58
-
59
-
60
-
61
-
62
-
63
-
64
-
65
-
66
-
67
-
68
-
69
-
70
-
71
-
72
-
73
-
74
-
75
-
76
-
77
-
78
-
79
-
80
-
81
-
82
-
83
-
84
-
85
-
86
-
87
-
88
-
89
-
90
-
91
-
92
-
93
-
94
-
95
-
96
-
97
-
98
-
99
-
100
-
101
-
102
-
103
-
104
-
105
-
106
-
107
-
108
-
109
-
110
-
111
-
112
-
113
-
114
-
115
-
116
-
117
-
118
-
119
-
120
-
121
-
122
-
123
-
124
-
125
-
126
-
127
-
128
-
129
-
130
-
131
-
132
-
133
-
134
-
135
-
136
-
137
-
138
-
139
-
140
-
141
-
142
-
143
-
144
-
145
-
146
-
147
-
148
-
149
-
150
-
151
-
152
-
153
-
154
-
155
-
156
-
157
-
158
-
159
-
160
-
161
-
162
-
163
-
164
-
165
-
166
-
167
-
168
-
169
-
170
-
171
-
172
-
173
-
174
-
175
-
176
-
177
-
178
-
179
-
180
-
181
-
182
-
183
-
184
-
185
-
186
-
187
-
188
-
189
-
190
-
191
-
192
-
193
-
194
-
195
-
196
-
197
-
198
-
199
-
200
-
201
-
202
-
203
-
204
-
205
-
206
-
207
-
208
-
209
-
210
-
211
-
212
-
213
-
214
-
215
-
216
-
217
-
218
-
219
-
 220
220 -
 221
221 -
 222
222 -
 223
223 -
 224
224 -
 225
225 -
 226
226 -
 227
227 -
 228
228 -
 229
229 -
 230
230 -
 231
231 -
 232
232 -
 233
233 -
 234
234 -
 235
235 -
 236
236 -
 237
237 -
 238
238 -
 239
239 -
 240
240 -
241
-
242
-
243
-
244
-
245
-
246
-
247
-
248
-
249
-
250
-
251
-
252
-
253
-
254
-
255
-
256
-
257
-
258
-
259
-
260
-
261
-
262
-
263
-
264
-
265
-
266
-
267
-
268
-
269
-
270
-
271
-
272
-
273
-
274
-
275
-
276
-
277
-
278
-
279
-
280
-
281
-
282
-
283
-
284
-
285
-
286
-
287
-
288
-
289
-
290
-
291
-
292
 |
 |

TYCO INTERNATIONAL LTD.
NOTES TO CONSOLIDATED FINANCIAL STATEMENTS
16. Tyco Shareholders’ Equity (Continued)
March 12, 2009. The following steps occurred in connection with the Change of Domicile, which did
not result in a change to total Shareholders’ Equity:
(1) approximately 21 million shares held directly or indirectly in treasury were cancelled;
(2) the par value of common shares of the Company was increased from $0.80 to CHF 8.53
through an approximate 1-for-9 reverse share split, followed by the issuance of approximately
eight fully paid up shares so that the same number of shares were outstanding before and
after the Change of Domicile, which reduced share premium and increased common shares;
and
(3) the remaining amount of share premium was eliminated with a corresponding increase to
contributed surplus.
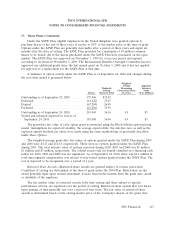
Share Repurchase Program
The Company’s Board of Directors approved the $1.0 billion 2010 Share Repurchase Program,
$1.0 billion 2008 Share Repurchase Program and the $1.0 billion 2007 Share Repurchase Program, in
September 2010, July 2008 and September 2007, respectively. During fiscal 2010, the Company
repurchased approximately 24 million shares for approximately $900 million under the 2008 share
repurchase program, which reduced the amount of common shares outstanding and decreased the
dividends declared on the consolidated Statement of Shareholders’ Equity as of September 24, 2010.
The following table represents the number of shares and dollar amount of repurchases made under
each of the Company’s repurchase programs by fiscal year and the remaining amount available for
repurchase as of September 24, 2010:
2010 Share 2008 Share 2007 Share
Repurchase Program Repurchase Program Repurchase Program
Shares Amount Shares Amount Shares Amount
(in millions) ($ in billions) (in millions) ($ in billions) (in millions) ($ in billions)
Approved Repurchase Amount . . . $1.0 $1.0 $1.0
Repurchases
Fiscal 2010 .............. — — 24.3 0.9 — —
Fiscal 2009 .............. N/A N/A — — — —
Fiscal 2008 .............. N/A N/A 2.5 0.1 23.1 0.9
Fiscal 2007 .............. N/A N/A N/A N/A 1.3 0.1
Remaining Amount Available .... $1.0 $— $—
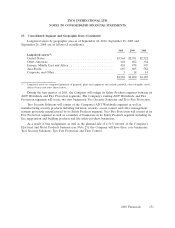
17. Share Plans
Total share-based compensation cost recognized during 2010 and 2009 was $120 million and
$99 million, respectively, all of which is included in selling, general and administrative expenses. Total
share-based compensation cost recognized during 2008 was $104 million, which includes $100 million in
selling, general and administrative expenses and $4 million in discontinued operations. The Company
has recognized a related tax benefit associated with its share-based compensation arrangements during
2010, 2009 and 2008 of $35 million, $25 million and $28 million ($1 million in discontinued operations),
respectively.
142 2010 Financials