ADT 2010 Annual Report Download - page 240
Download and view the complete annual report
Please find page 240 of the 2010 ADT annual report below. You can navigate through the pages in the report by either clicking on the pages listed below, or by using the keyword search tool below to find specific information within the annual report.-
 1
1 -
2
-
3
-
4
-
5
-
6
-
7
-
8
-
9
-
10
-
11
-
12
-
13
-
14
-
15
-
16
-
17
-
18
-
19
-
20
-
21
-
22
-
23
-
24
-
25
-
26
-
27
-
28
-
29
-
30
-
31
-
32
-
33
-
34
-
35
-
36
-
37
-
38
-
39
-
40
-
41
-
42
-
43
-
44
-
45
-
46
-
47
-
48
-
49
-
50
-
51
-
52
-
53
-
54
-
55
-
56
-
57
-
58
-
59
-
60
-
61
-
62
-
63
-
64
-
65
-
66
-
67
-
68
-
69
-
70
-
71
-
72
-
73
-
74
-
75
-
76
-
77
-
78
-
79
-
80
-
81
-
82
-
83
-
84
-
85
-
86
-
87
-
88
-
89
-
90
-
91
-
92
-
93
-
94
-
95
-
96
-
97
-
98
-
99
-
100
-
101
-
102
-
103
-
104
-
105
-
106
-
107
-
108
-
109
-
110
-
111
-
112
-
113
-
114
-
115
-
116
-
117
-
118
-
119
-
120
-
121
-
122
-
123
-
124
-
125
-
126
-
127
-
128
-
129
-
130
-
131
-
132
-
133
-
134
-
135
-
136
-
137
-
138
-
139
-
140
-
141
-
142
-
143
-
144
-
145
-
146
-
147
-
148
-
149
-
150
-
151
-
152
-
153
-
154
-
155
-
156
-
157
-
158
-
159
-
160
-
161
-
162
-
163
-
164
-
165
-
166
-
167
-
168
-
169
-
170
-
171
-
172
-
173
-
174
-
175
-
176
-
177
-
178
-
179
-
180
-
181
-
182
-
183
-
184
-
185
-
186
-
187
-
188
-
189
-
190
-
191
-
192
-
193
-
194
-
195
-
196
-
197
-
198
-
199
-
200
-
201
-
202
-
203
-
204
-
205
-
206
-
207
-
208
-
209
-
210
-
211
-
212
-
213
-
214
-
215
-
216
-
217
-
218
-
219
-
220
-
221
-
222
-
223
-
224
-
225
-
226
-
227
-
228
-
229
-
 230
230 -
 231
231 -
 232
232 -
 233
233 -
 234
234 -
 235
235 -
 236
236 -
 237
237 -
 238
238 -
 239
239 -
 240
240 -
 241
241 -
 242
242 -
 243
243 -
 244
244 -
 245
245 -
 246
246 -
 247
247 -
 248
248 -
 249
249 -
 250
250 -
251
-
252
-
253
-
254
-
255
-
256
-
257
-
258
-
259
-
260
-
261
-
262
-
263
-
264
-
265
-
266
-
267
-
268
-
269
-
270
-
271
-
272
-
273
-
274
-
275
-
276
-
277
-
278
-
279
-
280
-
281
-
282
-
283
-
284
-
285
-
286
-
287
-
288
-
289
-
290
-
291
-
292
 |
 |

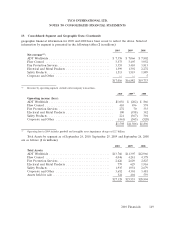
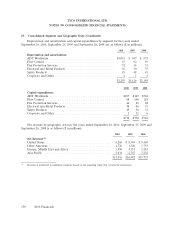
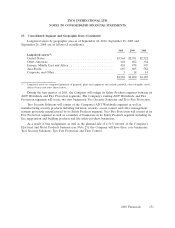
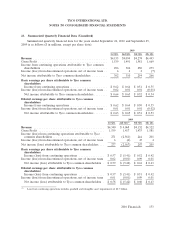
TYCO INTERNATIONAL LTD.
NOTES TO CONSOLIDATED FINANCIAL STATEMENTS
20. Supplementary Consolidated Balance Sheet Information
Selected supplementary Consolidated Balance Sheet information as of September 24, 2010 and
September 25, 2009 is as follows ($ in millions):
2010 2009
Deferred tax asset—non current ................................ $1,131 $1,105
Other non-current assets ...................................... 1,465 1,537
Other assets ............................................. $2,596 $2,642
Accrued payroll and payroll related costs .......................... 665 540
Deferred income tax liability-current ............................. 61 43
Income taxes payable—current .................................. 102 83
Other .................................................... 1,843 1,772
Accrued and other current liabilities ............................ $2,671 $2,438
Long-term pension and postretirement liabilities ..................... 847 807
Deferred income tax liability—non-current ......................... 605 264
Income taxes payable—non-current .............................. 238 221
Other .................................................... 1,311 1,399
Other liabilities ........................................... $3,001 $2,691
21. Inventory
Inventories consisted of the following ($ in millions):
September 24, September 25,
2010 2009
Purchased materials and manufactured parts ................ $ 504 $ 482
Work in process ..................................... 192 194
Finished goods ...................................... 747 694
Inventories ....................................... $1,443 $1,370
Inventories are recorded at the lower of cost (primarily first-in, first-out) or market value.
22. Property, Plant and Equipment
Property, plant and equipment consisted of the following ($ in millions):
September 24, September 25,
2010 2009
Land............................................. $ 154 $ 144
Buildings .......................................... 816 745
Subscriber systems ................................... 6,085 5,309
Machinery and equipment ............................. 2,457 2,324
Property under capital leases(1) .......................... 62 62
Construction in progress ............................... 154 164
Accumulated depreciation(2) ............................ (5,572) (5,311)
Property, Plant and Equipment, net ..................... $4,156 $ 3,437
(1) Property under capital leases consists primarily of buildings.
(2) Accumulated amortization of capital lease assets was $34 million and $28 million as of September 24, 2010 and
September 25, 2009, respectively.
152 2010 Financials