ADT 2010 Annual Report Download - page 52
Download and view the complete annual report
Please find page 52 of the 2010 ADT annual report below. You can navigate through the pages in the report by either clicking on the pages listed below, or by using the keyword search tool below to find specific information within the annual report.-
 1
1 -
2
-
3
-
4
-
5
-
6
-
7
-
8
-
9
-
10
-
11
-
12
-
13
-
14
-
15
-
16
-
17
-
18
-
19
-
20
-
21
-
22
-
23
-
24
-
25
-
26
-
27
-
28
-
29
-
30
-
31
-
32
-
33
-
34
-
35
-
36
-
37
-
38
-
39
-
40
-
41
-
 42
42 -
 43
43 -
 44
44 -
 45
45 -
 46
46 -
 47
47 -
 48
48 -
 49
49 -
 50
50 -
 51
51 -
 52
52 -
 53
53 -
 54
54 -
 55
55 -
 56
56 -
 57
57 -
 58
58 -
 59
59 -
 60
60 -
 61
61 -
 62
62 -
63
-
64
-
65
-
66
-
67
-
68
-
69
-
70
-
71
-
72
-
73
-
74
-
75
-
76
-
77
-
78
-
79
-
80
-
81
-
82
-
83
-
84
-
85
-
86
-
87
-
88
-
89
-
90
-
91
-
92
-
93
-
94
-
95
-
96
-
97
-
98
-
99
-
100
-
101
-
102
-
103
-
104
-
105
-
106
-
107
-
108
-
109
-
110
-
111
-
112
-
113
-
114
-
115
-
116
-
117
-
118
-
119
-
120
-
121
-
122
-
123
-
124
-
125
-
126
-
127
-
128
-
129
-
130
-
131
-
132
-
133
-
134
-
135
-
136
-
137
-
138
-
139
-
140
-
141
-
142
-
143
-
144
-
145
-
146
-
147
-
148
-
149
-
150
-
151
-
152
-
153
-
154
-
155
-
156
-
157
-
158
-
159
-
160
-
161
-
162
-
163
-
164
-
165
-
166
-
167
-
168
-
169
-
170
-
171
-
172
-
173
-
174
-
175
-
176
-
177
-
178
-
179
-
180
-
181
-
182
-
183
-
184
-
185
-
186
-
187
-
188
-
189
-
190
-
191
-
192
-
193
-
194
-
195
-
196
-
197
-
198
-
199
-
200
-
201
-
202
-
203
-
204
-
205
-
206
-
207
-
208
-
209
-
210
-
211
-
212
-
213
-
214
-
215
-
216
-
217
-
218
-
219
-
220
-
221
-
222
-
223
-
224
-
225
-
226
-
227
-
228
-
229
-
230
-
231
-
232
-
233
-
234
-
235
-
236
-
237
-
238
-
239
-
240
-
241
-
242
-
243
-
244
-
245
-
246
-
247
-
248
-
249
-
250
-
251
-
252
-
253
-
254
-
255
-
256
-
257
-
258
-
259
-
260
-
261
-
262
-
263
-
264
-
265
-
266
-
267
-
268
-
269
-
270
-
271
-
272
-
273
-
274
-
275
-
276
-
277
-
278
-
279
-
280
-
281
-
282
-
283
-
284
-
285
-
286
-
287
-
288
-
289
-
290
-
291
-
292
 |
 |

• The Company continued to invest in its businesses to strengthen its long-term competitive
capabilities for both products and services. For example, capital spending levels grew modestly
during fiscal 2010, as they have throughout the economic downturn, and a high percentage of
this spending was directed toward research and development and other investments that are
expected to grow service revenue. As a result of this type of investment, ADT Worldwide was
able to introduce its ADT Pulse interactive security services product in test markets during the
year.
• The Company also executed on its acquisition strategy, acquiring Broadview Security in May
2010. This acquisition increases the Company’s recurring revenue base, brings additional
capabilities and capacity to generate new high quality accounts and expands the Company’s
install and service expertise.
• The Company continued to focus its efforts on increasing its presence in emerging markets such
as China, India, Brazil and the Middle East. In December 2009, the Company acquired two
valve manufacturers in Brazil, which expands and complements Flow Control’s product offerings
and market position in South America.
• The Company completed the last major portion of its portfolio refinement efforts when it
reached an agreement to sell a majority stake in its Electrical and Metal Products business.
Earlier in the year, ADT Worldwide completed the sale of its French security business and Flow
Control completed the sale of its European water business. These dispositions are expected to
improve operating margins, decrease volatility in financial results and allow the Company to
focus more intensely on its three core businesses.
• The Company continued to generate solid cash flow. As described above, the Company used its
cash to make growth oriented investments and acquisitions. The Company also returned
$1.3 billion through share repurchases and dividends.
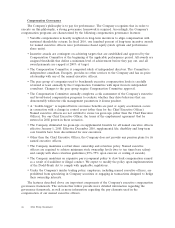
Pay for Performance
The actions described above were undertaken in an effort to position the Company for long-term
sustainable growth. The Company’s executive compensation programs are aligned with these initiatives,
and have been designed to pay commensurate with the level of performance generated. This philosophy
is most evident in the mix of pay used to compensate our executives. For our Chief Executive Officer,
approximately 70% of targeted direct pay (which excludes fluctuations in pension value and perquisites)
in fiscal 2010 was conveyed in the form of long-term equity awards, and 17% was conveyed in the form
of a targeted annual performance bonus. Of the equity component, 50% of the awards were
performance share units, which will expire as worthless if the Company’s performance through fiscal
2012 is not within the upper 65% of the companies comprising the S&P 500 Industrials Index. The
other 50% of the equity award was in the form of stock options, the value of which corresponds
directly to increases and decreases in the Company’s stock price. As described below, fiscal 2010
compensation for our other named executive officers was also heavily weighted with long-term equity-
based compensation, the ultimate value of which depends on Company performance.
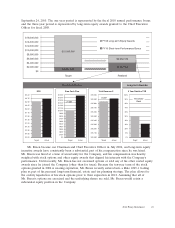
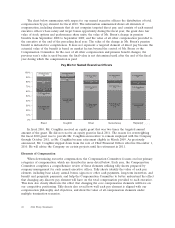
As discussed above, the Company’s performance in fiscal 2010 exceeded expectations. As a result,
annual performance bonuses paid out above target. However, over a three year period, the Company’s
stock price did not perform as well as peers. As a result, performance share units granted in July 2007
expired in 2010 with no realized value, and stock options granted at the same time are currently out of
the money. Only restricted stock units that were granted in July 2007 have provided value to this point
in time. The table below graphically illustrates this point. It shows the connection between the
Company’s performance and our Chief Executive Officer’s compensation over the corresponding time
periods. The table shows the ‘‘at risk’’ portion of our Chief Executive Officer’s compensation, which
represents over half of his compensation, for the one and three year periods that ended on
44 2011 Proxy Statement