ADT 2010 Annual Report Download - page 242
Download and view the complete annual report
Please find page 242 of the 2010 ADT annual report below. You can navigate through the pages in the report by either clicking on the pages listed below, or by using the keyword search tool below to find specific information within the annual report.-
 1
1 -
2
-
3
-
4
-
5
-
6
-
7
-
8
-
9
-
10
-
11
-
12
-
13
-
14
-
15
-
16
-
17
-
18
-
19
-
20
-
21
-
22
-
23
-
24
-
25
-
26
-
27
-
28
-
29
-
30
-
31
-
32
-
33
-
34
-
35
-
36
-
37
-
38
-
39
-
40
-
41
-
42
-
43
-
44
-
45
-
46
-
47
-
48
-
49
-
50
-
51
-
52
-
53
-
54
-
55
-
56
-
57
-
58
-
59
-
60
-
61
-
62
-
63
-
64
-
65
-
66
-
67
-
68
-
69
-
70
-
71
-
72
-
73
-
74
-
75
-
76
-
77
-
78
-
79
-
80
-
81
-
82
-
83
-
84
-
85
-
86
-
87
-
88
-
89
-
90
-
91
-
92
-
93
-
94
-
95
-
96
-
97
-
98
-
99
-
100
-
101
-
102
-
103
-
104
-
105
-
106
-
107
-
108
-
109
-
110
-
111
-
112
-
113
-
114
-
115
-
116
-
117
-
118
-
119
-
120
-
121
-
122
-
123
-
124
-
125
-
126
-
127
-
128
-
129
-
130
-
131
-
132
-
133
-
134
-
135
-
136
-
137
-
138
-
139
-
140
-
141
-
142
-
143
-
144
-
145
-
146
-
147
-
148
-
149
-
150
-
151
-
152
-
153
-
154
-
155
-
156
-
157
-
158
-
159
-
160
-
161
-
162
-
163
-
164
-
165
-
166
-
167
-
168
-
169
-
170
-
171
-
172
-
173
-
174
-
175
-
176
-
177
-
178
-
179
-
180
-
181
-
182
-
183
-
184
-
185
-
186
-
187
-
188
-
189
-
190
-
191
-
192
-
193
-
194
-
195
-
196
-
197
-
198
-
199
-
200
-
201
-
202
-
203
-
204
-
205
-
206
-
207
-
208
-
209
-
210
-
211
-
212
-
213
-
214
-
215
-
216
-
217
-
218
-
219
-
220
-
221
-
222
-
223
-
224
-
225
-
226
-
227
-
228
-
229
-
230
-
231
-
 232
232 -
 233
233 -
 234
234 -
 235
235 -
 236
236 -
 237
237 -
 238
238 -
 239
239 -
 240
240 -
 241
241 -
 242
242 -
 243
243 -
 244
244 -
 245
245 -
 246
246 -
 247
247 -
 248
248 -
 249
249 -
 250
250 -
 251
251 -
 252
252 -
253
-
254
-
255
-
256
-
257
-
258
-
259
-
260
-
261
-
262
-
263
-
264
-
265
-
266
-
267
-
268
-
269
-
270
-
271
-
272
-
273
-
274
-
275
-
276
-
277
-
278
-
279
-
280
-
281
-
282
-
283
-
284
-
285
-
286
-
287
-
288
-
289
-
290
-
291
-
292
 |
 |

TYCO INTERNATIONAL LTD.
NOTES TO CONSOLIDATED FINANCIAL STATEMENTS
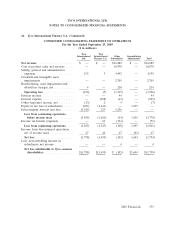
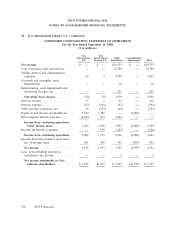
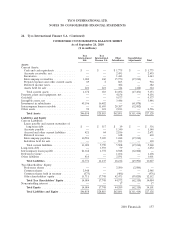
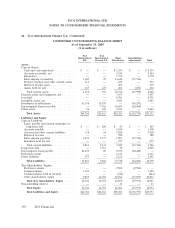
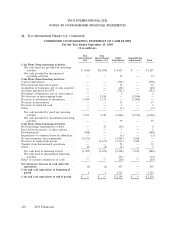
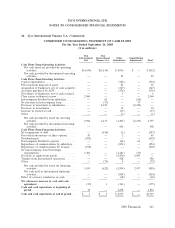
24. Tyco International Finance S.A.
TIFSA, a wholly-owned subsidiary of the Company, has public debt securities outstanding (see
Note 11) which are fully and unconditionally guaranteed by Tyco. The following tables present
condensed consolidating financial information for Tyco, TIFSA and all other subsidiaries. Condensed
financial information for Tyco and TIFSA on a stand-alone basis is presented using the equity method
of accounting for subsidiaries.
During the second quarter of 2008, the Company completed a tax-free restructuring involving the
transfer of certain investments from Tyco to TIFSA. Since the transactions were entirely among wholly-
owned subsidiaries of Tyco, there was no impact on the Company’s consolidated financial position,
results of operations or cash flows. The transactions did, however, result in an increase to TIFSA’s
investment in subsidiaries of $1.9 billion. Since these transactions were among entities under common
control, their effects have been reflected as of the beginning of the earliest period presented.
CONDENSED CONSOLIDATING STATEMENT OF OPERATIONS
For the Year Ended September 24, 2010
($ in millions)
Tyco Tyco
International International Other Consolidating
Ltd. Finance S.A. Subsidiaries Adjustments Total
Net revenue ..................... $ — $ — $17,016 $ — $17,016
Cost of product sales and services ..... — — 10,736 — 10,736
Selling, general and administrative
expenses ...................... 15 2 4,569 — 4,586
Restructuring, asset impairment and
divestiture charges, net ........... — — 96 — 96
Operating (loss) income .......... (15) (2) 1,615 — 1,598
Interest income .................. — — 31 — 31
Interest expense .................. — (278) (6) — (284)
Other income (expense), net ......... 8 (87) 4 — (75)
Equity in net income of subsidiaries .... 2,506 1,142 — (3,648) —
Intercompany interest and fees ....... (1,374) 347 1,027 — —
Income from continuing operations
before income taxes ............ 1,125 1,122 2,671 (3,648) 1,270
Income tax benefit (expense) ......... — 8 (146) — (138)
Income from continuing operations . . 1,125 1,130 2,525 (3,648) 1,132
Income from discontinued operations,
net of income taxes .............. 7 7 7 (14) 7
Net income .................... 1,132 1,137 2,532 (3,662) 1,139
Less: noncontrolling interest in
subsidiaries net income ........... — — 7 — 7
Net income attributable to Tyco
common shareholders .......... $1,132 $1,137 $ 2,525 $(3,662) $ 1,132
154 2010 Financials