ADT 2010 Annual Report Download - page 77
Download and view the complete annual report
Please find page 77 of the 2010 ADT annual report below. You can navigate through the pages in the report by either clicking on the pages listed below, or by using the keyword search tool below to find specific information within the annual report.-
 1
1 -
2
-
3
-
4
-
5
-
6
-
7
-
8
-
9
-
10
-
11
-
12
-
13
-
14
-
15
-
16
-
17
-
18
-
19
-
20
-
21
-
22
-
23
-
24
-
25
-
26
-
27
-
28
-
29
-
30
-
31
-
32
-
33
-
34
-
35
-
36
-
37
-
38
-
39
-
40
-
41
-
42
-
43
-
44
-
45
-
46
-
47
-
48
-
49
-
50
-
51
-
52
-
53
-
54
-
55
-
56
-
57
-
58
-
59
-
60
-
61
-
62
-
63
-
64
-
65
-
66
-
 67
67 -
 68
68 -
 69
69 -
 70
70 -
 71
71 -
 72
72 -
 73
73 -
 74
74 -
 75
75 -
 76
76 -
 77
77 -
 78
78 -
 79
79 -
 80
80 -
 81
81 -
 82
82 -
 83
83 -
 84
84 -
 85
85 -
 86
86 -
 87
87 -
88
-
89
-
90
-
91
-
92
-
93
-
94
-
95
-
96
-
97
-
98
-
99
-
100
-
101
-
102
-
103
-
104
-
105
-
106
-
107
-
108
-
109
-
110
-
111
-
112
-
113
-
114
-
115
-
116
-
117
-
118
-
119
-
120
-
121
-
122
-
123
-
124
-
125
-
126
-
127
-
128
-
129
-
130
-
131
-
132
-
133
-
134
-
135
-
136
-
137
-
138
-
139
-
140
-
141
-
142
-
143
-
144
-
145
-
146
-
147
-
148
-
149
-
150
-
151
-
152
-
153
-
154
-
155
-
156
-
157
-
158
-
159
-
160
-
161
-
162
-
163
-
164
-
165
-
166
-
167
-
168
-
169
-
170
-
171
-
172
-
173
-
174
-
175
-
176
-
177
-
178
-
179
-
180
-
181
-
182
-
183
-
184
-
185
-
186
-
187
-
188
-
189
-
190
-
191
-
192
-
193
-
194
-
195
-
196
-
197
-
198
-
199
-
200
-
201
-
202
-
203
-
204
-
205
-
206
-
207
-
208
-
209
-
210
-
211
-
212
-
213
-
214
-
215
-
216
-
217
-
218
-
219
-
220
-
221
-
222
-
223
-
224
-
225
-
226
-
227
-
228
-
229
-
230
-
231
-
232
-
233
-
234
-
235
-
236
-
237
-
238
-
239
-
240
-
241
-
242
-
243
-
244
-
245
-
246
-
247
-
248
-
249
-
250
-
251
-
252
-
253
-
254
-
255
-
256
-
257
-
258
-
259
-
260
-
261
-
262
-
263
-
264
-
265
-
266
-
267
-
268
-
269
-
270
-
271
-
272
-
273
-
274
-
275
-
276
-
277
-
278
-
279
-
280
-
281
-
282
-
283
-
284
-
285
-
286
-
287
-
288
-
289
-
290
-
291
-
292
 |
 |

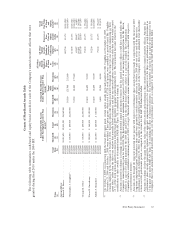
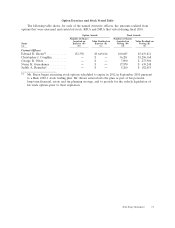
Outstanding Equity Awards at Fiscal Year-End Table
The following table shows, for each of the named executive officers, all equity awards that were
outstanding as of September 24, 2010. Dollar amounts are based on the NYSE closing price of $38.55
for the Company’s common stock on September 24, 2010.
Option Awards Stock Awards
Equity Incentive
Equity Incentive Plan Awards:
Market Plan Awards: Market or
Number of Number of Number of Value of Number of Payout Value of
Securities Securities Shares or Shares or Unearned Unearned
Underlying Underlying Units of Units of Shares, Units Shares, Units
Unexercised Unexercised Option Option Stock That Stock That or Other Rights or Other Rights
Options: (#) Options: (#) Exercise Expiration Have Not Have Not That Have Not That Have Not
Name Exercisable Unexercisable(1) Price ($) Date Vested(2) (#) Vested ($) Vested (#)(3) Vested ($)(3)
(a) (b) (c) (d) (e) (f) (g) (h) (i)
Current Officers
Edward D. Breen ......... 1,675,943 — $15.89 7/24/2012 80,309 $3,095,912 281,000 $10,832,550
49,749 — $52.43 3/25/2014
49,749 — $57.19 3/25/2014
49,749 — $63.55 3/25/2014
49,749 — $58.78 3/9/2015
49,749 — $65.13 3/9/2015
49,749 — $71.49 3/9/2015
124,374 — $46.07 11/21/2015
299,785 99,929 $48.14 11/20/2016
219,000 73,000 $53.36 7/1/2017
138,525 415,575 $29.00 10/6/2018
— 449,700 $33.75 9/30/2019
Christopher J. Coughlin ..... 24,874 — $56.60 3/6/2015 36,908 $1,422,803 140,500 $ 5,416,275
62,187 — $56.87 3/9/2015
62,187 — $46.07 11/21/2015
141,630 47,211 $48.14 11/20/2016
104,250 34,750 $53.36 7/1/2017
46,175 138,525 $29.00 10/6/2018
— 317,400 $33.75 9/30/2019
George R. Oliver ......... 62,947 — $43.72 7/9/2016 19,772 $ 762,211 62,800 $ 2,420,940
53,250 17,750 $53.36 7/1/2017
— 35,000 $44.49 8/17/2018
32,325 96,975 $29.00 10/6/2018
— 95,200 $33.75 9/30/2019
Naren K. Gursahaney ...... 84,978 — $23.77 3/2/2013 30,051 $1,158,466 62,800 $ 2,420,940
37,768 — $44.16 3/25/2014
31,473 — $56.87 3/9/2015
25,178 — $46.07 11/21/2015
9,442 — $48.67 1/11/2016
66,093 22,032 $48.14 11/20/2016
53,250 17,750 $53.36 7/1/2017
— 35,000 $44.49 8/17/2018
32,325 96,975 $29.00 10/6/2018
— 95,200 $33.75 9/30/2019
Judith A. Reinsdorf ....... 33,492 11,165 $51.14 5/9/2017 5,288 $ 203,852 49,700 $ 1,915,935
35,250 11,750 $53.36 7/1/2017
24,625 73,875 $29.00 10/6/2018
— 79,300 $33.75 9/30/2019
(1) Vesting dates for each outstanding option award for the named executive officers are as follows:
2011 Proxy Statement 69