ADT 2010 Annual Report Download - page 132
Download and view the complete annual report
Please find page 132 of the 2010 ADT annual report below. You can navigate through the pages in the report by either clicking on the pages listed below, or by using the keyword search tool below to find specific information within the annual report.-
 1
1 -
2
-
3
-
4
-
5
-
6
-
7
-
8
-
9
-
10
-
11
-
12
-
13
-
14
-
15
-
16
-
17
-
18
-
19
-
20
-
21
-
22
-
23
-
24
-
25
-
26
-
27
-
28
-
29
-
30
-
31
-
32
-
33
-
34
-
35
-
36
-
37
-
38
-
39
-
40
-
41
-
42
-
43
-
44
-
45
-
46
-
47
-
48
-
49
-
50
-
51
-
52
-
53
-
54
-
55
-
56
-
57
-
58
-
59
-
60
-
61
-
62
-
63
-
64
-
65
-
66
-
67
-
68
-
69
-
70
-
71
-
72
-
73
-
74
-
75
-
76
-
77
-
78
-
79
-
80
-
81
-
82
-
83
-
84
-
85
-
86
-
87
-
88
-
89
-
90
-
91
-
92
-
93
-
94
-
95
-
96
-
97
-
98
-
99
-
100
-
101
-
102
-
103
-
104
-
105
-
106
-
107
-
108
-
109
-
110
-
111
-
112
-
113
-
114
-
115
-
116
-
117
-
118
-
119
-
120
-
121
-
 122
122 -
 123
123 -
 124
124 -
 125
125 -
 126
126 -
 127
127 -
 128
128 -
 129
129 -
 130
130 -
 131
131 -
 132
132 -
 133
133 -
 134
134 -
 135
135 -
 136
136 -
 137
137 -
 138
138 -
 139
139 -
 140
140 -
 141
141 -
 142
142 -
143
-
144
-
145
-
146
-
147
-
148
-
149
-
150
-
151
-
152
-
153
-
154
-
155
-
156
-
157
-
158
-
159
-
160
-
161
-
162
-
163
-
164
-
165
-
166
-
167
-
168
-
169
-
170
-
171
-
172
-
173
-
174
-
175
-
176
-
177
-
178
-
179
-
180
-
181
-
182
-
183
-
184
-
185
-
186
-
187
-
188
-
189
-
190
-
191
-
192
-
193
-
194
-
195
-
196
-
197
-
198
-
199
-
200
-
201
-
202
-
203
-
204
-
205
-
206
-
207
-
208
-
209
-
210
-
211
-
212
-
213
-
214
-
215
-
216
-
217
-
218
-
219
-
220
-
221
-
222
-
223
-
224
-
225
-
226
-
227
-
228
-
229
-
230
-
231
-
232
-
233
-
234
-
235
-
236
-
237
-
238
-
239
-
240
-
241
-
242
-
243
-
244
-
245
-
246
-
247
-
248
-
249
-
250
-
251
-
252
-
253
-
254
-
255
-
256
-
257
-
258
-
259
-
260
-
261
-
262
-
263
-
264
-
265
-
266
-
267
-
268
-
269
-
270
-
271
-
272
-
273
-
274
-
275
-
276
-
277
-
278
-
279
-
280
-
281
-
282
-
283
-
284
-
285
-
286
-
287
-
288
-
289
-
290
-
291
-
292
 |
 |
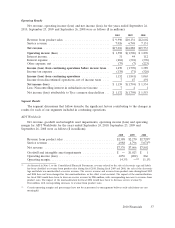
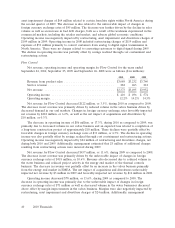
Operating income increased $588 million during 2010 compared to 2009. Operating income during
2009 was negatively affected by goodwill impairment charges of $567 million recorded at the Access
Controls and Video Systems (‘‘ACVS’’) and Life Safety reporting units. The increase in operating
income is attributable to the increased sales volume in the electronic security and life safety businesses
and a shift in product mix to higher margin products across all businesses, which was partially offset by
the fire suppression sales volume decline discussed above and increased sales and marketing expense.
Restructuring, asset impairment and divestiture charges, net was $12 million during 2010 as compared
to $32 million of restructuring charges during 2009. Additionally, management estimated that $7 million
of additional charges resulting from restructuring actions were incurred during 2009 as compared to no
additional charges during 2010. Savings realized through cost containment and restructuring actions
also contributed to the increase in operating income. Changes in foreign currency exchange rates
favorably impacted operating income by $6 million.
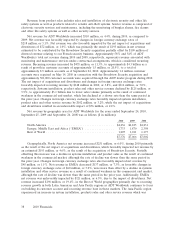
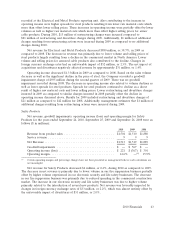
Net revenue for Safety Products decreased $370 million, or 19.6%, during 2009 as compared to
2008. The decrease was primarily related to reduced volume in our fire suppression business, life safety
and electronic security businesses, which were impacted by soft economic conditions. The remaining
decrease was related to the unfavorable impact of changes in foreign currency exchange rates of $114
million, 6.0%. The decrease in our fire suppression business was primarily due to reduced spending in
the commercial construction market. The decrease in the life safety business was primarily due to
reduced municipal spending. The electronic security business decrease was primarily due to the slow
down in the retail sector, as retail capital projects and new store openings were canceled or delayed.
Operating income decreased $668 million in 2009 as compared to 2008. The decline was primarily
attributable to goodwill and intangible impairment charges of $567 million recorded during the quarter
ended March 27, 2009 as a result of the slowdown in the commercial and retail markets. As discussed
above, decreased sales volume within the fire suppression, life safety and electronic security businesses
also negatively impacted operating income. Operating income was negatively impacted by restructuring
charges of $32 million during 2009. Additionally, management estimates that $7 million of additional
charges resulting from restructuring actions were incurred during 2009. The same period in the prior
year included $47 million of restructuring and asset impairment charges, net. Operating income in 2009
also decreased by $16 million due to unfavorable changes in foreign currency exchange rates. Operating
income was also negatively impacted by a charge of $8 million relating to the amount of depreciation
and amortization expense that would have been recorded had a business that was previously classified
as held for sale been continuously classified as held and used (see Note 2 to the Consolidated Financial
Statements).
Corporate and Other
Corporate expense decreased $104 million, or 18.4%, to $461 million for 2010 compared to
$565 million in 2009. Corporate expense during 2009 was negatively affected by approximately
$125 million of charges related to legacy securities matters partially offset by a $16 million benefit
related to a settlement reached with a former executive. Restructuring charges decreased to $1 million
for 2010 as compared to $10 million in 2009. Corporate expense was also favorably impacted by savings
realized through cost containment and restructuring charges. These decreases in Corporate expenses
were partially offset by a $52 million net asbestos charge recorded during the third quarter of 2010 as
compared to a $37 million net asbestos charge in 2009, both of which were recorded in conjunction
with the valuation of our asbestos-related liabilities and insurance assets. In addition, $4 million of
divestiture charges, net, and $3 million of acquisition costs were recorded during the 2010 as compared
to $6 million of divestiture charges, net, and nil of acquisition costs for 2009.
Corporate expense for 2009 was $45 million higher as compared to the prior year, primarily
resulting from a charge of approximately $125 million related to the settlement of legacy securities
matters, which was partially offset by $16 million benefit related to a settlement reached with a former
44 2010 Financials