ADT 2010 Annual Report Download - page 133
Download and view the complete annual report
Please find page 133 of the 2010 ADT annual report below. You can navigate through the pages in the report by either clicking on the pages listed below, or by using the keyword search tool below to find specific information within the annual report.-
 1
1 -
2
-
3
-
4
-
5
-
6
-
7
-
8
-
9
-
10
-
11
-
12
-
13
-
14
-
15
-
16
-
17
-
18
-
19
-
20
-
21
-
22
-
23
-
24
-
25
-
26
-
27
-
28
-
29
-
30
-
31
-
32
-
33
-
34
-
35
-
36
-
37
-
38
-
39
-
40
-
41
-
42
-
43
-
44
-
45
-
46
-
47
-
48
-
49
-
50
-
51
-
52
-
53
-
54
-
55
-
56
-
57
-
58
-
59
-
60
-
61
-
62
-
63
-
64
-
65
-
66
-
67
-
68
-
69
-
70
-
71
-
72
-
73
-
74
-
75
-
76
-
77
-
78
-
79
-
80
-
81
-
82
-
83
-
84
-
85
-
86
-
87
-
88
-
89
-
90
-
91
-
92
-
93
-
94
-
95
-
96
-
97
-
98
-
99
-
100
-
101
-
102
-
103
-
104
-
105
-
106
-
107
-
108
-
109
-
110
-
111
-
112
-
113
-
114
-
115
-
116
-
117
-
118
-
119
-
120
-
121
-
122
-
 123
123 -
 124
124 -
 125
125 -
 126
126 -
 127
127 -
 128
128 -
 129
129 -
 130
130 -
 131
131 -
 132
132 -
 133
133 -
 134
134 -
 135
135 -
 136
136 -
 137
137 -
 138
138 -
 139
139 -
 140
140 -
 141
141 -
 142
142 -
 143
143 -
144
-
145
-
146
-
147
-
148
-
149
-
150
-
151
-
152
-
153
-
154
-
155
-
156
-
157
-
158
-
159
-
160
-
161
-
162
-
163
-
164
-
165
-
166
-
167
-
168
-
169
-
170
-
171
-
172
-
173
-
174
-
175
-
176
-
177
-
178
-
179
-
180
-
181
-
182
-
183
-
184
-
185
-
186
-
187
-
188
-
189
-
190
-
191
-
192
-
193
-
194
-
195
-
196
-
197
-
198
-
199
-
200
-
201
-
202
-
203
-
204
-
205
-
206
-
207
-
208
-
209
-
210
-
211
-
212
-
213
-
214
-
215
-
216
-
217
-
218
-
219
-
220
-
221
-
222
-
223
-
224
-
225
-
226
-
227
-
228
-
229
-
230
-
231
-
232
-
233
-
234
-
235
-
236
-
237
-
238
-
239
-
240
-
241
-
242
-
243
-
244
-
245
-
246
-
247
-
248
-
249
-
250
-
251
-
252
-
253
-
254
-
255
-
256
-
257
-
258
-
259
-
260
-
261
-
262
-
263
-
264
-
265
-
266
-
267
-
268
-
269
-
270
-
271
-
272
-
273
-
274
-
275
-
276
-
277
-
278
-
279
-
280
-
281
-
282
-
283
-
284
-
285
-
286
-
287
-
288
-
289
-
290
-
291
-
292
 |
 |
executive. Additionally, corporate expense in 2009 included $16 million of restructuring, asset
impairment and divestiture charges, net. Corporate expense for 2008 included net charges of
$28 million composed of a $29 million charge for a legacy legal settlement, $4 million of separation
costs and $5 million for restructuring, asset impairment and divestiture charges, net, offset by a credit
of $10 million for class action settlement recoveries. The remaining decrease in corporate expense is
primarily related to cost reduction initiatives and the restructuring program.
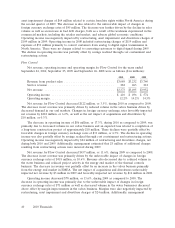
Interest Income and Expense
Interest income was $31 million in 2010, as compared to $44 million and $112 million in 2009 and
2008, respectively. The decrease in interest income from 2009 primarily related to lower investment
yields.
Interest expense was $284 million in 2010, as compared to $301 million and $396 million in 2009
and 2008, respectively. The decrease in interest expense is primarily related to savings from interest
rate swaps and no amounts being drawn under the revolving credit facilities in 2010, partially offset by
additional interest associated with the January and October 2009 debt issuances.
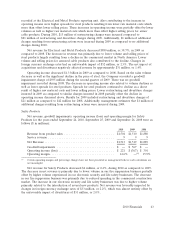
The weighted-average interest rate on total debt outstanding as of September 24, 2010,
September 25, 2009 and September 26, 2008 was 6.3%, 6.6% and 6.2%, respectively.
Other Expense, Net
Other expense, net of $75 million in 2010 primarily relates to a charge of $87 million as a loss on
extinguishment of debt on the redemption of our 6.375% public notes due 2011, 7% notes due 2028
and 6.875% notes due 2029. See Note 11. This loss was partially offset by an $8 million gain recorded
as a result of an increase in the receivables due from Covidien and Tyco Electronics under the Tax
Sharing Agreement. See Note 6.
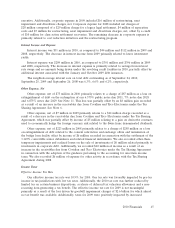
Other expense, net of $7 million in 2009 primarily relates to a $14 million charge recorded as a
result of a decrease in the receivables due from Covidien and Tyco Electronics under the Tax Sharing
Agreement, which was partially offset by income of $5 million relating to a gain on derivative contracts
used to economically hedge the foreign currency risk related to the Swiss franc denominated dividends.
Other expense, net of $223 million in 2008 primarily relates to a charge of $258 million as a loss
on extinguishment of debt related to the consent solicitation and exchange offers and termination of
the bridge loan facility offset by income of $6 million recorded in connection with the settlement of the
3.125% convertible senior debentures and related financial instruments. We also recorded other-than-
temporary impairments and realized losses on the sale of investments of $6 million related primarily to
investments in corporate debt. Additionally, we recorded $40 million of income as a result of an
increase in the receivables due from Covidien and Tyco Electronics under the Tax Sharing Agreement
in connection with the adoption of the guidance pertaining to the accounting for uncertain income
taxes. We also recorded $6 million of expense for other activity in accordance with the Tax Sharing
Agreement during 2008.
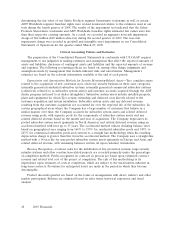
Income Taxes
Effective Income Tax Rate
Our effective income tax rate was 10.9% for 2010. Our tax rate was favorably impacted by pre-tax
income in tax jurisdictions with low tax rates. Additionally, the 2010 tax rate was further reduced by
limited tax on certain business dispositions, a release of deferred tax valuation allowances and a non-
recurring item generating a tax benefit. The effective income tax rate for 2009 is not meaningful
primarily as a result of the loss driven by goodwill impairment charges of $2.6 billion for which almost
no tax benefit was available. Additionally, taxes for 2009 were positively impacted by increased
2010 Financials 45