ADT 2010 Annual Report Download - page 197
Download and view the complete annual report
Please find page 197 of the 2010 ADT annual report below. You can navigate through the pages in the report by either clicking on the pages listed below, or by using the keyword search tool below to find specific information within the annual report.-
 1
1 -
2
-
3
-
4
-
5
-
6
-
7
-
8
-
9
-
10
-
11
-
12
-
13
-
14
-
15
-
16
-
17
-
18
-
19
-
20
-
21
-
22
-
23
-
24
-
25
-
26
-
27
-
28
-
29
-
30
-
31
-
32
-
33
-
34
-
35
-
36
-
37
-
38
-
39
-
40
-
41
-
42
-
43
-
44
-
45
-
46
-
47
-
48
-
49
-
50
-
51
-
52
-
53
-
54
-
55
-
56
-
57
-
58
-
59
-
60
-
61
-
62
-
63
-
64
-
65
-
66
-
67
-
68
-
69
-
70
-
71
-
72
-
73
-
74
-
75
-
76
-
77
-
78
-
79
-
80
-
81
-
82
-
83
-
84
-
85
-
86
-
87
-
88
-
89
-
90
-
91
-
92
-
93
-
94
-
95
-
96
-
97
-
98
-
99
-
100
-
101
-
102
-
103
-
104
-
105
-
106
-
107
-
108
-
109
-
110
-
111
-
112
-
113
-
114
-
115
-
116
-
117
-
118
-
119
-
120
-
121
-
122
-
123
-
124
-
125
-
126
-
127
-
128
-
129
-
130
-
131
-
132
-
133
-
134
-
135
-
136
-
137
-
138
-
139
-
140
-
141
-
142
-
143
-
144
-
145
-
146
-
147
-
148
-
149
-
150
-
151
-
152
-
153
-
154
-
155
-
156
-
157
-
158
-
159
-
160
-
161
-
162
-
163
-
164
-
165
-
166
-
167
-
168
-
169
-
170
-
171
-
172
-
173
-
174
-
175
-
176
-
177
-
178
-
179
-
180
-
181
-
182
-
183
-
184
-
185
-
186
-
 187
187 -
 188
188 -
 189
189 -
 190
190 -
 191
191 -
 192
192 -
 193
193 -
 194
194 -
 195
195 -
 196
196 -
 197
197 -
 198
198 -
 199
199 -
 200
200 -
 201
201 -
 202
202 -
 203
203 -
 204
204 -
 205
205 -
 206
206 -
 207
207 -
208
-
209
-
210
-
211
-
212
-
213
-
214
-
215
-
216
-
217
-
218
-
219
-
220
-
221
-
222
-
223
-
224
-
225
-
226
-
227
-
228
-
229
-
230
-
231
-
232
-
233
-
234
-
235
-
236
-
237
-
238
-
239
-
240
-
241
-
242
-
243
-
244
-
245
-
246
-
247
-
248
-
249
-
250
-
251
-
252
-
253
-
254
-
255
-
256
-
257
-
258
-
259
-
260
-
261
-
262
-
263
-
264
-
265
-
266
-
267
-
268
-
269
-
270
-
271
-
272
-
273
-
274
-
275
-
276
-
277
-
278
-
279
-
280
-
281
-
282
-
283
-
284
-
285
-
286
-
287
-
288
-
289
-
290
-
291
-
292
 |
 |

TYCO INTERNATIONAL LTD.
NOTES TO CONSOLIDATED FINANCIAL STATEMENTS
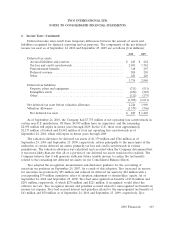
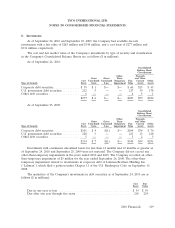
8. Investments
As of September 24, 2010 and September 25, 2009, the Company had available-for-sale
investments with a fair value of $283 million and $340 million, and a cost basis of $277 million and
$334 million, respectively.
The cost and fair market value of the Company’s investments by type of security and classification
in the Company’s Consolidated Balance Sheets are as follows ($ in millions):
As of September 24, 2010:
Consolidated
Balance Sheet
Classification
Other- Prepaids
Gross Gross Than- and Other
Cost Unrealized Unrealized Temporary Fair Current Other
Type of Security Basis Gain Loss Impairment Value Assets Assets
Corporate debt securities ............... $ 59 $ 1 $— $— $ 60 $15 $ 45
U.S. government debt securities .......... 212 5 — — 217 39 178
Other debt securities .................. 6 — — — 6 5 1
$277 $ 6 $— $— $283 $59 $224
As of September 25, 2009:
Consolidated
Balance Sheet
Classification
Other- Prepaids
Gross Gross Than- and Other
Cost Unrealized Unrealized Temporary Fair Current Other
Type of Security Basis Gain Loss Impairment Value Assets Assets
Corporate debt securities ............... $101 $ 4 $(1) $— $104 $34 $ 70
U.S. government debt securities .......... 228 3 — — 231 13 218
Other debt securities .................. 5 — — — 5 2 3
$334 $ 7 $(1) $— $340 $49 $291
Investments with continuous unrealized losses for less than 12 months and 12 months or greater as
of September 24, 2010 and September 25, 2009 were not material. The Company did not record any
other-than-temporary impairments in the years ended 2010 and 2009. The Company recorded an other-
than-temporary impairment of $5 million for the year ended September 26, 2008. The other-than-
temporary impairment related to investments in corporate debt of Lehman Brothers Holding, Inc
(‘‘Lehman’’), which filed a petition under Chapter 11 of the U.S. Bankruptcy Code on September 15,
2008.
The maturities of the Company’s investments in debt securities as of September 24, 2010 are as
follows ($ in millions):
Cost Fair
Basis Value
Due in one year or less ......................................... $ 59 $ 59
Due after one year through five years ............................... 218 224
2010 Financials 109