ADT 2010 Annual Report Download - page 234
Download and view the complete annual report
Please find page 234 of the 2010 ADT annual report below. You can navigate through the pages in the report by either clicking on the pages listed below, or by using the keyword search tool below to find specific information within the annual report.-
 1
1 -
2
-
3
-
4
-
5
-
6
-
7
-
8
-
9
-
10
-
11
-
12
-
13
-
14
-
15
-
16
-
17
-
18
-
19
-
20
-
21
-
22
-
23
-
24
-
25
-
26
-
27
-
28
-
29
-
30
-
31
-
32
-
33
-
34
-
35
-
36
-
37
-
38
-
39
-
40
-
41
-
42
-
43
-
44
-
45
-
46
-
47
-
48
-
49
-
50
-
51
-
52
-
53
-
54
-
55
-
56
-
57
-
58
-
59
-
60
-
61
-
62
-
63
-
64
-
65
-
66
-
67
-
68
-
69
-
70
-
71
-
72
-
73
-
74
-
75
-
76
-
77
-
78
-
79
-
80
-
81
-
82
-
83
-
84
-
85
-
86
-
87
-
88
-
89
-
90
-
91
-
92
-
93
-
94
-
95
-
96
-
97
-
98
-
99
-
100
-
101
-
102
-
103
-
104
-
105
-
106
-
107
-
108
-
109
-
110
-
111
-
112
-
113
-
114
-
115
-
116
-
117
-
118
-
119
-
120
-
121
-
122
-
123
-
124
-
125
-
126
-
127
-
128
-
129
-
130
-
131
-
132
-
133
-
134
-
135
-
136
-
137
-
138
-
139
-
140
-
141
-
142
-
143
-
144
-
145
-
146
-
147
-
148
-
149
-
150
-
151
-
152
-
153
-
154
-
155
-
156
-
157
-
158
-
159
-
160
-
161
-
162
-
163
-
164
-
165
-
166
-
167
-
168
-
169
-
170
-
171
-
172
-
173
-
174
-
175
-
176
-
177
-
178
-
179
-
180
-
181
-
182
-
183
-
184
-
185
-
186
-
187
-
188
-
189
-
190
-
191
-
192
-
193
-
194
-
195
-
196
-
197
-
198
-
199
-
200
-
201
-
202
-
203
-
204
-
205
-
206
-
207
-
208
-
209
-
210
-
211
-
212
-
213
-
214
-
215
-
216
-
217
-
218
-
219
-
220
-
221
-
222
-
223
-
 224
224 -
 225
225 -
 226
226 -
 227
227 -
 228
228 -
 229
229 -
 230
230 -
 231
231 -
 232
232 -
 233
233 -
 234
234 -
 235
235 -
 236
236 -
 237
237 -
 238
238 -
 239
239 -
 240
240 -
 241
241 -
 242
242 -
 243
243 -
 244
244 -
245
-
246
-
247
-
248
-
249
-
250
-
251
-
252
-
253
-
254
-
255
-
256
-
257
-
258
-
259
-
260
-
261
-
262
-
263
-
264
-
265
-
266
-
267
-
268
-
269
-
270
-
271
-
272
-
273
-
274
-
275
-
276
-
277
-
278
-
279
-
280
-
281
-
282
-
283
-
284
-
285
-
286
-
287
-
288
-
289
-
290
-
291
-
292
 |
 |

TYCO INTERNATIONAL LTD.
NOTES TO CONSOLIDATED FINANCIAL STATEMENTS
17. Share Plans (Continued)
Restricted share awards that vest dependent upon attainment of various levels of performance that
equal or exceed targeted levels generally vest in their entirety three years from the grant date. The fair
value of performance share awards is determined based on the Monte Carlo valuation model. The
compensation expense recognized for restricted share awards is net of estimated forfeitures.
The Company generally grants restricted stock units. Recipients of restricted stock units have no
voting rights and receive dividend equivalent units. Recipients of performance shares have no voting
rights and may receive dividend equivalent units depending on the terms of the grant.
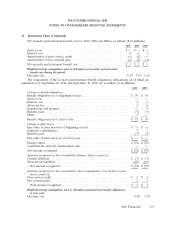
A summary of the activity of the Company’s restricted share awards including performance shares
as of September 24, 2010 and changes during the year then ended is presented in the tables below:
Weighted-Average
Grant-Date
Non-vested Restricted Share Awards Shares Fair Value
Non-vested as of September 25, 2009 .................... 3,736,710 $38.75
Granted .......................................... 1,551,591 34.23
Vested ........................................... (1,346,549) 42.21
Forfeited ......................................... (270,726) 36.82
Non-vested as of September 24, 2010 .................... 3,671,026 35.76
The weighted-average grant-date fair value of restricted share awards granted during 2010, 2009
and 2008 was $34.23, $28.56 and $40.27, respectively. The total fair value of restricted share awards
vested during 2010, 2009 and 2008 was $54 million, $74 million and $41 million, respectively.
Weighted-Average
Grant-Date
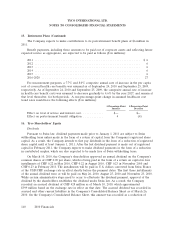
Non-vested Performance Share Awards Shares Fair Value
Non-vested as of September 25, 2009 ..................... 1,417,523 $38.71
Granted .......................................... 830,660 40.27
Forfeited .......................................... (519,031) 58.32
Non-vested as of September 24, 2010 ..................... 1,729,152 33.57
The weighted-average grant-date fair value of performance share awards granted during 2010, 2009
and 2008 was $40.27, $27.84 and $46.11, respectively. No performance shares vested during 2010, 2009
and 2008.
As of September 24, 2010, there was $89 million of total unrecognized compensation cost related
to both non-vested restricted share awards and performance shares. That cost is expected to be
recognized over a weighted-average period of 2.0 fiscal years.
Deferred Stock Units—Deferred Stock Units (‘‘DSUs’’) are notional units that are tied to the value
of Tyco common shares with distribution deferred until termination of employment or service to the
Company. Distribution, when made, will be in the form of actual shares. Similar to restricted share
grants that vest through the passage of time, the fair value of DSUs is determined based on the closing
market price of the Company’s shares on the grant date and is amortized to expense over the vesting
period. Recipients of DSUs do not have the right to vote and receive cash dividends. However, they
146 2010 Financials