ADT 2010 Annual Report Download - page 198
Download and view the complete annual report
Please find page 198 of the 2010 ADT annual report below. You can navigate through the pages in the report by either clicking on the pages listed below, or by using the keyword search tool below to find specific information within the annual report.-
 1
1 -
2
-
3
-
4
-
5
-
6
-
7
-
8
-
9
-
10
-
11
-
12
-
13
-
14
-
15
-
16
-
17
-
18
-
19
-
20
-
21
-
22
-
23
-
24
-
25
-
26
-
27
-
28
-
29
-
30
-
31
-
32
-
33
-
34
-
35
-
36
-
37
-
38
-
39
-
40
-
41
-
42
-
43
-
44
-
45
-
46
-
47
-
48
-
49
-
50
-
51
-
52
-
53
-
54
-
55
-
56
-
57
-
58
-
59
-
60
-
61
-
62
-
63
-
64
-
65
-
66
-
67
-
68
-
69
-
70
-
71
-
72
-
73
-
74
-
75
-
76
-
77
-
78
-
79
-
80
-
81
-
82
-
83
-
84
-
85
-
86
-
87
-
88
-
89
-
90
-
91
-
92
-
93
-
94
-
95
-
96
-
97
-
98
-
99
-
100
-
101
-
102
-
103
-
104
-
105
-
106
-
107
-
108
-
109
-
110
-
111
-
112
-
113
-
114
-
115
-
116
-
117
-
118
-
119
-
120
-
121
-
122
-
123
-
124
-
125
-
126
-
127
-
128
-
129
-
130
-
131
-
132
-
133
-
134
-
135
-
136
-
137
-
138
-
139
-
140
-
141
-
142
-
143
-
144
-
145
-
146
-
147
-
148
-
149
-
150
-
151
-
152
-
153
-
154
-
155
-
156
-
157
-
158
-
159
-
160
-
161
-
162
-
163
-
164
-
165
-
166
-
167
-
168
-
169
-
170
-
171
-
172
-
173
-
174
-
175
-
176
-
177
-
178
-
179
-
180
-
181
-
182
-
183
-
184
-
185
-
186
-
187
-
 188
188 -
 189
189 -
 190
190 -
 191
191 -
 192
192 -
 193
193 -
 194
194 -
 195
195 -
 196
196 -
 197
197 -
 198
198 -
 199
199 -
 200
200 -
 201
201 -
 202
202 -
 203
203 -
 204
204 -
 205
205 -
 206
206 -
 207
207 -
 208
208 -
209
-
210
-
211
-
212
-
213
-
214
-
215
-
216
-
217
-
218
-
219
-
220
-
221
-
222
-
223
-
224
-
225
-
226
-
227
-
228
-
229
-
230
-
231
-
232
-
233
-
234
-
235
-
236
-
237
-
238
-
239
-
240
-
241
-
242
-
243
-
244
-
245
-
246
-
247
-
248
-
249
-
250
-
251
-
252
-
253
-
254
-
255
-
256
-
257
-
258
-
259
-
260
-
261
-
262
-
263
-
264
-
265
-
266
-
267
-
268
-
269
-
270
-
271
-
272
-
273
-
274
-
275
-
276
-
277
-
278
-
279
-
280
-
281
-
282
-
283
-
284
-
285
-
286
-
287
-
288
-
289
-
290
-
291
-
292
 |
 |

TYCO INTERNATIONAL LTD.
NOTES TO CONSOLIDATED FINANCIAL STATEMENTS
9. Goodwill and Intangible Assets
Goodwill
Annually, in the fiscal fourth quarter, and more frequently if triggering events occur, the Company
tests goodwill for impairment by comparing the fair value of each reporting unit with its carrying
amount. Fair value for each reporting unit is determined utilizing a discounted cash flow analysis based
on the Company’s forecast cash flows discounted using an estimated weighted-average cost of capital of
market participants. A market approach is utilized to corroborate the discounted cash flow analysis
performed at each reporting unit. If the carrying amount of a reporting unit exceeds its fair value,
goodwill is considered potentially impaired. In determining fair value, management relies on and
considers a number of factors, including operating results, business plans, economic projections,
including expectations and assumptions regarding the timing and degree of any economic recovery,
anticipated future cash flow, comparable market transactions (to the extent available), other market
data and the Company’s overall market capitalization. There were no goodwill impairments as a result
of performing the company’s 2010 annual impairment test.
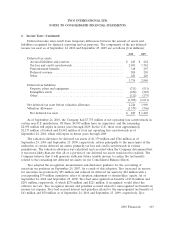
During the first quarter of 2010, businesses were realigned among the ADT Worldwide and Fire
Protection Services segments, ADT Worldwide and Safety Products segments and Fire Protection
Services and Safety Products segments. As a result of these realignments, goodwill was reallocated as
detailed below. As part of the realignment the Company tested the related goodwill balances for
recoverability and determined goodwill was recoverable.
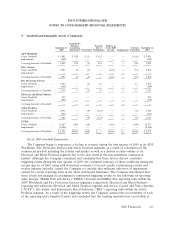
The changes in the carrying amount of goodwill by segment for 2009 and 2010 are as follows ($
in millions):
Acquisitions/
Purchase Transfers
September 26, Accounting due to Currency September 25,
2008 Adjustments Divestitures Realignment Impairments Translation 2009
ADT Worldwide
Gross Goodwill ............... $5,127 $ 3 — $(58) — $(111) $ 4,961
Impairments ................. (46) — — — (613) — (659)
Carrying Amount of Goodwill ...... 5,081 3 — (58) (613) (111) 4,302
Flow Control
Gross Goodwill ............... 1,993 1 (2) 2 — (1) 1,993
Impairments ................. — — — — — — —
Carrying Amount of Goodwill ...... 1,993 1 (2) 2 — (1) 1,993
Fire Protection Services
Gross Goodwill ............... 1,476 (1) — 56 — (8) 1,523
Impairments ................. (9) — — — (180) — (189)
Carrying Amount of Goodwill ...... 1,467 (1) — 56 (180) (8) 1,334
Electrical and Metal Products
Gross Goodwill ............... 1,024 — (6) (7) — (76) 935
Impairments ................. — — — — (935) — (935)
Carrying Amount of Goodwill ...... 1,024 — (6) (7) (935) (76) —
Safety Products
Gross Goodwill ............... 2,054 26 — 7 — (12) 2,075
Impairments ................. — — — — (913) — (913)
Carrying Amount of Goodwill ...... 2,054 26 — 7 (913) (12) 1,162
TOTAL
Gross Goodwill ............... 11,674 29 (8) — — (208) 11,487
Impairments ................. (55) — — — (2,641) — (2,696)
Carrying Amount of Goodwill ...... $11,619 $29 $ (8) $ — $(2,641) $(208) $ 8,791
110 2010 Financials