ADT 2010 Annual Report Download - page 196
Download and view the complete annual report
Please find page 196 of the 2010 ADT annual report below. You can navigate through the pages in the report by either clicking on the pages listed below, or by using the keyword search tool below to find specific information within the annual report.-
 1
1 -
2
-
3
-
4
-
5
-
6
-
7
-
8
-
9
-
10
-
11
-
12
-
13
-
14
-
15
-
16
-
17
-
18
-
19
-
20
-
21
-
22
-
23
-
24
-
25
-
26
-
27
-
28
-
29
-
30
-
31
-
32
-
33
-
34
-
35
-
36
-
37
-
38
-
39
-
40
-
41
-
42
-
43
-
44
-
45
-
46
-
47
-
48
-
49
-
50
-
51
-
52
-
53
-
54
-
55
-
56
-
57
-
58
-
59
-
60
-
61
-
62
-
63
-
64
-
65
-
66
-
67
-
68
-
69
-
70
-
71
-
72
-
73
-
74
-
75
-
76
-
77
-
78
-
79
-
80
-
81
-
82
-
83
-
84
-
85
-
86
-
87
-
88
-
89
-
90
-
91
-
92
-
93
-
94
-
95
-
96
-
97
-
98
-
99
-
100
-
101
-
102
-
103
-
104
-
105
-
106
-
107
-
108
-
109
-
110
-
111
-
112
-
113
-
114
-
115
-
116
-
117
-
118
-
119
-
120
-
121
-
122
-
123
-
124
-
125
-
126
-
127
-
128
-
129
-
130
-
131
-
132
-
133
-
134
-
135
-
136
-
137
-
138
-
139
-
140
-
141
-
142
-
143
-
144
-
145
-
146
-
147
-
148
-
149
-
150
-
151
-
152
-
153
-
154
-
155
-
156
-
157
-
158
-
159
-
160
-
161
-
162
-
163
-
164
-
165
-
166
-
167
-
168
-
169
-
170
-
171
-
172
-
173
-
174
-
175
-
176
-
177
-
178
-
179
-
180
-
181
-
182
-
183
-
184
-
185
-
 186
186 -
 187
187 -
 188
188 -
 189
189 -
 190
190 -
 191
191 -
 192
192 -
 193
193 -
 194
194 -
 195
195 -
 196
196 -
 197
197 -
 198
198 -
 199
199 -
 200
200 -
 201
201 -
 202
202 -
 203
203 -
 204
204 -
 205
205 -
 206
206 -
207
-
208
-
209
-
210
-
211
-
212
-
213
-
214
-
215
-
216
-
217
-
218
-
219
-
220
-
221
-
222
-
223
-
224
-
225
-
226
-
227
-
228
-
229
-
230
-
231
-
232
-
233
-
234
-
235
-
236
-
237
-
238
-
239
-
240
-
241
-
242
-
243
-
244
-
245
-
246
-
247
-
248
-
249
-
250
-
251
-
252
-
253
-
254
-
255
-
256
-
257
-
258
-
259
-
260
-
261
-
262
-
263
-
264
-
265
-
266
-
267
-
268
-
269
-
270
-
271
-
272
-
273
-
274
-
275
-
276
-
277
-
278
-
279
-
280
-
281
-
282
-
283
-
284
-
285
-
286
-
287
-
288
-
289
-
290
-
291
-
292
 |
 |

TYCO INTERNATIONAL LTD.
NOTES TO CONSOLIDATED FINANCIAL STATEMENTS
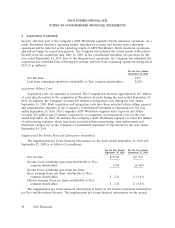
7. Earnings Per Share (Continued)
The reconciliations between basic and diluted earnings per share attributable to Tyco common
shareholders for 2010, 2009 and 2008 are as follows (in millions, except per share data):
2010 2009 2008
Per Share Per Share Per Share
Income Shares Amount Loss Shares Amount Income Shares Amount
Basic earnings per share
attributable to Tyco
common shareholders:
Income (loss) from
continuing operations . $1,125 485 $2.32 $(1,845) 473 $(3.90) $1,062 484 $2.19
Less: Income allocated
to participating
securities .......... NA
(1) —NA
(2) ——
(3) —
Share options, restricted
share awards and
deferred stock units . . — 3 — — — 3
Exchange of convertible
debt ............. — — — — 1 1
Diluted earnings per share
attributable to Tyco
common shareholders: ..
Add: Income allocated
to participating
securities .......... NA
(1) —NA
(2) ——
(3) —
Income (loss) from
continuing operations
attributable to Tyco
common shareholders,
giving effect to dilutive
adjustments .......... $1,125 488 $2.31 $(1,845) 473 $(3.90) $1,063 488 $2.18
(1) The two-class method is not applicable for the fiscal year ended September 24, 2010 as all participating securities were
vested as of September 25, 2009.
(2) The two-class method is not applicable for the fiscal year ended September 25, 2009 as the effects would be anti-dilutive
because the Company reported a loss from continuing operations for this period.
(3) Income allocated to participating securities rounds to zero.
The computation of diluted earnings per share for 2010 excludes the effect of the potential
exercise of share options to purchase approximately 15 million shares and excludes restricted share
awards of approximately 2 million shares because the effect would be anti-dilutive.
The computation of diluted earnings per share for 2009 and 2008 excludes the effect of the
potential exercise of share options to purchase approximately 27 million and 19 million shares,
respectively, and excludes restricted share awards of approximately 5 million and 4 million shares,
respectively, because the effect would be anti-dilutive.
108 2010 Financials