ADT 2010 Annual Report Download - page 128
Download and view the complete annual report
Please find page 128 of the 2010 ADT annual report below. You can navigate through the pages in the report by either clicking on the pages listed below, or by using the keyword search tool below to find specific information within the annual report.-
 1
1 -
2
-
3
-
4
-
5
-
6
-
7
-
8
-
9
-
10
-
11
-
12
-
13
-
14
-
15
-
16
-
17
-
18
-
19
-
20
-
21
-
22
-
23
-
24
-
25
-
26
-
27
-
28
-
29
-
30
-
31
-
32
-
33
-
34
-
35
-
36
-
37
-
38
-
39
-
40
-
41
-
42
-
43
-
44
-
45
-
46
-
47
-
48
-
49
-
50
-
51
-
52
-
53
-
54
-
55
-
56
-
57
-
58
-
59
-
60
-
61
-
62
-
63
-
64
-
65
-
66
-
67
-
68
-
69
-
70
-
71
-
72
-
73
-
74
-
75
-
76
-
77
-
78
-
79
-
80
-
81
-
82
-
83
-
84
-
85
-
86
-
87
-
88
-
89
-
90
-
91
-
92
-
93
-
94
-
95
-
96
-
97
-
98
-
99
-
100
-
101
-
102
-
103
-
104
-
105
-
106
-
107
-
108
-
109
-
110
-
111
-
112
-
113
-
114
-
115
-
116
-
117
-
 118
118 -
 119
119 -
 120
120 -
 121
121 -
 122
122 -
 123
123 -
 124
124 -
 125
125 -
 126
126 -
 127
127 -
 128
128 -
 129
129 -
 130
130 -
 131
131 -
 132
132 -
 133
133 -
 134
134 -
 135
135 -
 136
136 -
 137
137 -
 138
138 -
139
-
140
-
141
-
142
-
143
-
144
-
145
-
146
-
147
-
148
-
149
-
150
-
151
-
152
-
153
-
154
-
155
-
156
-
157
-
158
-
159
-
160
-
161
-
162
-
163
-
164
-
165
-
166
-
167
-
168
-
169
-
170
-
171
-
172
-
173
-
174
-
175
-
176
-
177
-
178
-
179
-
180
-
181
-
182
-
183
-
184
-
185
-
186
-
187
-
188
-
189
-
190
-
191
-
192
-
193
-
194
-
195
-
196
-
197
-
198
-
199
-
200
-
201
-
202
-
203
-
204
-
205
-
206
-
207
-
208
-
209
-
210
-
211
-
212
-
213
-
214
-
215
-
216
-
217
-
218
-
219
-
220
-
221
-
222
-
223
-
224
-
225
-
226
-
227
-
228
-
229
-
230
-
231
-
232
-
233
-
234
-
235
-
236
-
237
-
238
-
239
-
240
-
241
-
242
-
243
-
244
-
245
-
246
-
247
-
248
-
249
-
250
-
251
-
252
-
253
-
254
-
255
-
256
-
257
-
258
-
259
-
260
-
261
-
262
-
263
-
264
-
265
-
266
-
267
-
268
-
269
-
270
-
271
-
272
-
273
-
274
-
275
-
276
-
277
-
278
-
279
-
280
-
281
-
282
-
283
-
284
-
285
-
286
-
287
-
288
-
289
-
290
-
291
-
292
 |
 |

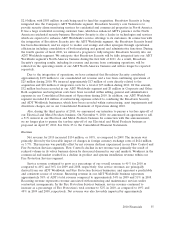
asset impairment charges of $64 million related to certain franchise rights within North America during
the second quarter of 2009. The decrease is also related to the unfavorable impact of changes in
foreign currency exchange rates of $45 million. The decrease was further driven by the decline in sales
volume as well as an increase in bad debt charges, both as a result of the weakness experienced in the
commercial markets, including the retailer end market, and adverse global economic conditions.
Operating income was negatively impacted by restructuring, asset impairment and divestiture charges of
$109 million in 2009. Operating income in 2008 included restructuring charges of $119 million and
expenses of $51 million primarily to convert customers from analog to digital signal transmission in
North America. There were no charges related to converting customers to digital signal during 2009.
The decline in operating income was partially offset by savings realized through cost containment and
restructuring actions.
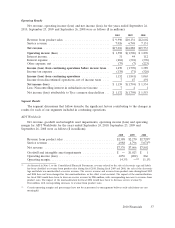
Flow Control
Net revenue, operating income and operating margin for Flow Control for the years ended
September 24, 2010, September 25, 2009 and September 26, 2008 were as follows ($ in millions):
2010 2009 2008
Revenue from product sales ............................. $3,089 $3,232 $3,740
Service revenue ...................................... 284 263 212
Net revenue ........................................ $3,373 $3,495 $3,952
Operating income .................................... $ 410 $ 496 $ 574
Operating margin ..................................... 12.2% 14.2% 14.5%
Net revenue for Flow Control decreased $122 million, or 3.5%, during 2010 as compared to 2009.
The decrease in net revenue was primarily driven by reduced volume in the valves business driven by
decreased demand in our end markets. Changes in foreign currency exchange rates favorably impacted
net revenue by $218 million, or 6.2%, as well as the net impact of acquisitions and divestitures by
$10 million, or 0.3%.
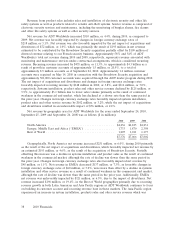
The decrease in operating income of $86 million, or 17.3%, during 2010 as compared to 2009, was
primarily due to decreased volume in our valves business and an expected loss related to completion of
a long-term construction project of approximately $18 million. These declines were partially offset by
favorable changes in foreign currency exchange rates of $31 million, or 6.3%. The decline in operating
income was also partially offset by savings realized through cost containment and restructuring actions.
Operating income was negatively impacted by $24 million of restructuring and divestiture charges, net
during both 2010 and 2009. Additionally, management estimated that $5 million of additional charges
resulting from restructuring actions were incurred during 2009.
Net revenue for Flow Control decreased $457 million, or 11.6%, during 2009 as compared to 2008.
The decrease in net revenue was primarily driven by the unfavorable impact of changes in foreign
currency exchange rates of $418 million, or 10.6%. Revenue also decreased due to reduced volume in
the water business and reduced project activity in the energy end market of the thermal controls
business. The decrease in revenue was partially offset by an increase in the valves business primarily
from the energy end market in EMEA. The net impact of acquisitions and divestitures unfavorably
impacted net revenue by $3 million in 2009 and favorably impacted net revenue by $16 million in 2008.
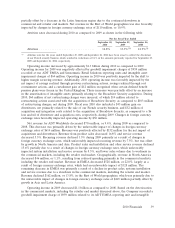
Operating income decreased $78 million, or 13.6%, during 2009 as compared to 2008. The
decrease in operating income was primarily due to the unfavorable impact of changes in foreign
currency exchange rates of $71 million as well as decreased volume in the water businesses discussed
above offset by margin improvements in the valves business. Margins were also negatively impacted by
restructuring, asset impairment and divestiture charges of $24 million. Additionally, management
40 2010 Financials