ADT 2010 Annual Report Download - page 129
Download and view the complete annual report
Please find page 129 of the 2010 ADT annual report below. You can navigate through the pages in the report by either clicking on the pages listed below, or by using the keyword search tool below to find specific information within the annual report.-
 1
1 -
2
-
3
-
4
-
5
-
6
-
7
-
8
-
9
-
10
-
11
-
12
-
13
-
14
-
15
-
16
-
17
-
18
-
19
-
20
-
21
-
22
-
23
-
24
-
25
-
26
-
27
-
28
-
29
-
30
-
31
-
32
-
33
-
34
-
35
-
36
-
37
-
38
-
39
-
40
-
41
-
42
-
43
-
44
-
45
-
46
-
47
-
48
-
49
-
50
-
51
-
52
-
53
-
54
-
55
-
56
-
57
-
58
-
59
-
60
-
61
-
62
-
63
-
64
-
65
-
66
-
67
-
68
-
69
-
70
-
71
-
72
-
73
-
74
-
75
-
76
-
77
-
78
-
79
-
80
-
81
-
82
-
83
-
84
-
85
-
86
-
87
-
88
-
89
-
90
-
91
-
92
-
93
-
94
-
95
-
96
-
97
-
98
-
99
-
100
-
101
-
102
-
103
-
104
-
105
-
106
-
107
-
108
-
109
-
110
-
111
-
112
-
113
-
114
-
115
-
116
-
117
-
118
-
 119
119 -
 120
120 -
 121
121 -
 122
122 -
 123
123 -
 124
124 -
 125
125 -
 126
126 -
 127
127 -
 128
128 -
 129
129 -
 130
130 -
 131
131 -
 132
132 -
 133
133 -
 134
134 -
 135
135 -
 136
136 -
 137
137 -
 138
138 -
 139
139 -
140
-
141
-
142
-
143
-
144
-
145
-
146
-
147
-
148
-
149
-
150
-
151
-
152
-
153
-
154
-
155
-
156
-
157
-
158
-
159
-
160
-
161
-
162
-
163
-
164
-
165
-
166
-
167
-
168
-
169
-
170
-
171
-
172
-
173
-
174
-
175
-
176
-
177
-
178
-
179
-
180
-
181
-
182
-
183
-
184
-
185
-
186
-
187
-
188
-
189
-
190
-
191
-
192
-
193
-
194
-
195
-
196
-
197
-
198
-
199
-
200
-
201
-
202
-
203
-
204
-
205
-
206
-
207
-
208
-
209
-
210
-
211
-
212
-
213
-
214
-
215
-
216
-
217
-
218
-
219
-
220
-
221
-
222
-
223
-
224
-
225
-
226
-
227
-
228
-
229
-
230
-
231
-
232
-
233
-
234
-
235
-
236
-
237
-
238
-
239
-
240
-
241
-
242
-
243
-
244
-
245
-
246
-
247
-
248
-
249
-
250
-
251
-
252
-
253
-
254
-
255
-
256
-
257
-
258
-
259
-
260
-
261
-
262
-
263
-
264
-
265
-
266
-
267
-
268
-
269
-
270
-
271
-
272
-
273
-
274
-
275
-
276
-
277
-
278
-
279
-
280
-
281
-
282
-
283
-
284
-
285
-
286
-
287
-
288
-
289
-
290
-
291
-
292
 |
 |

estimates that $5 million of additional charges resulting from restructuring actions were incurred during
2009. Restructuring, asset impairment and divestiture charges were $6 million in 2008. Additionally,
selling, general and administrative expenses during 2008 included an environmental remediation charge
of $6 million related to the closure of a facility in North America. The decline in operating income was
partially offset by savings realized through cost containment and restructuring actions.
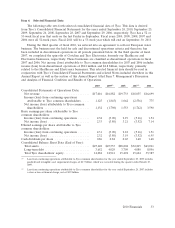
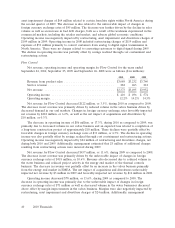
Fire Protection Services
Net revenue, goodwill impairment, operating income and operating margin for Fire Protection
Services for the years ended September 24, 2010, September 25, 2009 and September 26, 2008 were as
follows ($ in millions):
2010 2009 2008
Revenue from product sales ............................. $1,615 $1,734 $1,989
Service revenue ...................................... 1,740 1,676 1,824
Net Revenue ........................................ $3,355 $3,410 $3,813
Goodwill impairment .................................. $ — $ 180 $ 9
Operating income .................................... 272 70 333
Operating margin ..................................... 8.1% —(1) 8.7%
(1) Certain operating margins and percentage changes have not been presented as management believes such calculations are
not meaningful.
Revenue from product sales includes sales and installation of fire protection and other systems.
Service revenue consists of inspection, maintenance, service and monitoring of fire detection and
suppression systems.
Net revenue by geographic area for Fire Protection Services was as follows ($ in millions):
2010 2009 2008
North America ...................................... $1,940 $1,994 $2,111
International ........................................ 1,415 1,416 1,702
Net revenue ........................................ $3,355 $3,410 $3,813
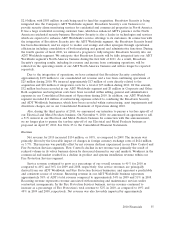
Net revenue for Fire Protection Services decreased $55 million, or 1.6%, during 2010 compared to
2009. This decrease was primarily due to continued weakness in commercial markets and a shift from
lower margin projects to higher projects, which more than offset the favorable changes in foreign
currency exchange rates of $118 million, or 3.5%. Geographically, net revenue in North America
decreased $54 million, or 2.7%, primarily due to the continued decline in systems installation and
upgrade activity in the sprinkler business. Reduced systems installation and upgrade activity in the
electronic business as well as service revenue in the sprinkler and suppression businesses also
contributed to the decrease, although to a much lesser extent. These declines were partially offset by an
increase in service revenue in the electronic business. Changes in foreign currency exchange rates
favorably impacted revenue in North America by $28 million, or 1.4%. Although net revenue in our
international fire businesses decreased by $1 million, changes in foreign currency exchange rates
favorably impacted net revenue by $90 million, or 6.4%, which was almost entirely offset by a decrease
in revenue due to continued weakness in the European commercial markets. The net impact of
acquisitions and divestitures unfavorably impacted revenue by $6 million, or 0.2%.
Operating income increased $202 million during 2010 as compared to 2009. Operating income
during 2009 was negatively affected by a goodwill impairment charge of $180 million recorded at the
EMEA Fire reporting unit. Additionally, operating income in 2010 was favorably impacted by savings
2010 Financials 41