ADT 2010 Annual Report Download - page 125
Download and view the complete annual report
Please find page 125 of the 2010 ADT annual report below. You can navigate through the pages in the report by either clicking on the pages listed below, or by using the keyword search tool below to find specific information within the annual report.-
 1
1 -
2
-
3
-
4
-
5
-
6
-
7
-
8
-
9
-
10
-
11
-
12
-
13
-
14
-
15
-
16
-
17
-
18
-
19
-
20
-
21
-
22
-
23
-
24
-
25
-
26
-
27
-
28
-
29
-
30
-
31
-
32
-
33
-
34
-
35
-
36
-
37
-
38
-
39
-
40
-
41
-
42
-
43
-
44
-
45
-
46
-
47
-
48
-
49
-
50
-
51
-
52
-
53
-
54
-
55
-
56
-
57
-
58
-
59
-
60
-
61
-
62
-
63
-
64
-
65
-
66
-
67
-
68
-
69
-
70
-
71
-
72
-
73
-
74
-
75
-
76
-
77
-
78
-
79
-
80
-
81
-
82
-
83
-
84
-
85
-
86
-
87
-
88
-
89
-
90
-
91
-
92
-
93
-
94
-
95
-
96
-
97
-
98
-
99
-
100
-
101
-
102
-
103
-
104
-
105
-
106
-
107
-
108
-
109
-
110
-
111
-
112
-
113
-
114
-
 115
115 -
 116
116 -
 117
117 -
 118
118 -
 119
119 -
 120
120 -
 121
121 -
 122
122 -
 123
123 -
 124
124 -
 125
125 -
 126
126 -
 127
127 -
 128
128 -
 129
129 -
 130
130 -
 131
131 -
 132
132 -
 133
133 -
 134
134 -
 135
135 -
136
-
137
-
138
-
139
-
140
-
141
-
142
-
143
-
144
-
145
-
146
-
147
-
148
-
149
-
150
-
151
-
152
-
153
-
154
-
155
-
156
-
157
-
158
-
159
-
160
-
161
-
162
-
163
-
164
-
165
-
166
-
167
-
168
-
169
-
170
-
171
-
172
-
173
-
174
-
175
-
176
-
177
-
178
-
179
-
180
-
181
-
182
-
183
-
184
-
185
-
186
-
187
-
188
-
189
-
190
-
191
-
192
-
193
-
194
-
195
-
196
-
197
-
198
-
199
-
200
-
201
-
202
-
203
-
204
-
205
-
206
-
207
-
208
-
209
-
210
-
211
-
212
-
213
-
214
-
215
-
216
-
217
-
218
-
219
-
220
-
221
-
222
-
223
-
224
-
225
-
226
-
227
-
228
-
229
-
230
-
231
-
232
-
233
-
234
-
235
-
236
-
237
-
238
-
239
-
240
-
241
-
242
-
243
-
244
-
245
-
246
-
247
-
248
-
249
-
250
-
251
-
252
-
253
-
254
-
255
-
256
-
257
-
258
-
259
-
260
-
261
-
262
-
263
-
264
-
265
-
266
-
267
-
268
-
269
-
270
-
271
-
272
-
273
-
274
-
275
-
276
-
277
-
278
-
279
-
280
-
281
-
282
-
283
-
284
-
285
-
286
-
287
-
288
-
289
-
290
-
291
-
292
 |
 |

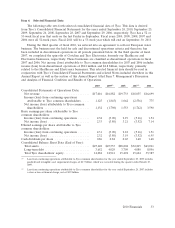
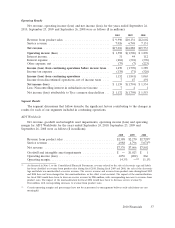
Operating Results
Net revenue, operating income (loss) and net income (loss) for the years ended September 24,
2010, September 25, 2009 and September 26, 2008 were as follows ($ in millions):
2010 2009 2008
Revenue from product sales .......................... $ 9,990 $10,134 $12,602
Service revenue ................................... 7,026 6,748 7,131
Net revenue ...................................... $17,016 $16,882 $19,733
Operating income (loss) ............................. $ 1,598 $ (1,506) $ 1,896
Interest income .................................... 31 44 112
Interest expense ................................... (284) (301) (396)
Other expense, net ................................. (75) (7) (223)
Income (loss) from continuing operations before income taxes . 1,270 (1,770) 1,389
Income tax expense ................................. (138) (71) (326)
Income (loss) from continuing operations ................ 1,132 (1,841) 1,063
Income from discontinued operations, net of income taxes .... 7 47 491
Net income (loss) .................................. $ 1,139 $(1,794) $ 1,554
Less: Noncontrolling interest in subsidiaries net income ......741
Net income (loss) attributable to Tyco common shareholders . . . $ 1,132 $(1,798) $ 1,553
Segment Results
The segment discussions that follow describe the significant factors contributing to the changes in
results for each of our segments included in continuing operations.
ADT Worldwide
Net revenue, goodwill and intangible asset impairments, operating income (loss) and operating
margin for ADT Worldwide for the years ended September 24, 2010, September 25, 2009 and
September 26, 2008 were as follows ($ in millions):
2010 2009 2008
Revenue from product sales ............................. $2,388 $2,270 $2,728(1)
Service revenue ...................................... 4,988 4,796 5,074(1)
Net revenue ........................................ $7,376 $7,066 $7,802
Goodwill and intangible asset impairments .................. $ — $1,023 $ 1
Operating income (loss) ................................ 1,056 (202) 866
Operating margin ..................................... 14.3% —(2) 11.1%
(1) As discussed in Note 1 to the Consolidated Financial Statements, revenue related to the sale of electronic tags and labels
has been classified as revenue from product sales during fiscal 2010. During fiscal 2009 and 2008, the sale of the electronic
tags and labels was misclassified as service revenue. The service revenue and revenue from product sales during fiscal 2009
and 2008 have not been changed for this misclassification, as the effect is not material. The impact of the misclassification
for fiscal 2009 would have been to decrease service revenue by $286 million, with corresponding increases to revenue from
product sales. The impact of the misclassification for fiscal 2008 would have been to decrease service revenue by
$364 million, with corresponding increases to revenue from product sales.
(2) Certain operating margins and percentages have not been presented as management believes such calculations are not
meaningful.
2010 Financials 37