ADT 2010 Annual Report Download - page 200
Download and view the complete annual report
Please find page 200 of the 2010 ADT annual report below. You can navigate through the pages in the report by either clicking on the pages listed below, or by using the keyword search tool below to find specific information within the annual report.
TYCO INTERNATIONAL LTD.
NOTES TO CONSOLIDATED FINANCIAL STATEMENTS
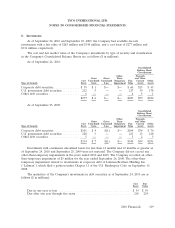
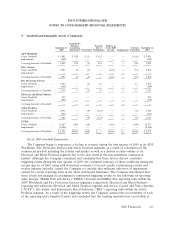
9. Goodwill and Intangible Assets (Continued)
March 27, 2009. Subsequently, the Company performed the first step of the goodwill impairment test
for these reporting units.
To perform the first step of the goodwill impairment test for the six reporting units with triggering
events, the Company compared the carrying amounts of these reporting units to their estimated fair
values. Fair value for each reporting unit was determined utilizing a discounted cash flow analysis based
on forecast cash flows (including estimated underlying revenue and operating income growth rates)
discounted using an estimated weighted average cost of capital of market participants. A market
approach, utilizing observable market data such as comparable companies in similar lines of business
that are publicly traded or which are part of a public or private transaction (to the extent available),
was used to corroborate the discounted cash flow analysis performed at each reporting unit. If the
carrying amount of a reporting unit exceeded its fair value, goodwill was considered potentially
impaired. In determining fair value, management relied on and considered a number of factors,
including operating results, business plans, economic projections, including expectations and
assumptions regarding the timing and degree of any economic recovery, anticipated future cash flow,
comparable market transactions (to the extent available), other market data and the Company’s overall
market capitalization.
As described above, the Company utilized a discounted cash flow analysis for determining the fair
value of each of the reporting units where triggering events had occurred. Based on the factors
described above, actual and anticipated reductions in demand for the reporting unit’s products and
services as well as increased risk due to economic uncertainty, the estimates of future cash flows used
in the second quarter of 2009 discounted cash flow analyses were revised downward from the
Company’s most recent test conducted during the fourth quarter of 2008. The range of the weighted-
average cost of capital utilized was increased to reflect increased risk due to economic volatility and
uncertainties related to demand for the Company’s products and services. The weighted-average cost of
capital were as follows:
Second Quarter Fourth Quarter
of 2009 of 2008
Weighted-Average Cost of Capital ................. 10.9% to 12.8% 10.0% to 11.7%
The results of the first step of the goodwill impairment test indicated there was a potential
impairment of goodwill in each of the six reporting units identified with triggering events, as the
carrying amounts of the reporting units exceeded their respective fair values. As a result, the Company
performed the second step of the goodwill impairment test for these reporting units. In the second step
of the goodwill impairment test, the Company compared the implied fair value of reporting unit
goodwill with the carrying amount of the reporting unit’s goodwill. The implied fair values of goodwill
were determined by allocating the fair values of each reporting unit to all of the assets and liabilities of
the applicable reporting unit including any unrecognized intangible assets as if the reporting unit had
been acquired in a business combination. The results of the second step of the goodwill impairment
test indicated that the implied goodwill amount was less than the carrying amount of goodwill for each
of the aforementioned reporting units. The Company recorded an aggregate non-cash impairment
charge of $2.6 billion ($2.6 billion after-tax) which was recorded in goodwill and intangible asset
impairments in the Company’s Consolidated Statement of Operations for the quarter ended March 27,
112 2010 Financials


