ADT 2010 Annual Report Download - page 56
Download and view the complete annual report
Please find page 56 of the 2010 ADT annual report below. You can navigate through the pages in the report by either clicking on the pages listed below, or by using the keyword search tool below to find specific information within the annual report.-
 1
1 -
2
-
3
-
4
-
5
-
6
-
7
-
8
-
9
-
10
-
11
-
12
-
13
-
14
-
15
-
16
-
17
-
18
-
19
-
20
-
21
-
22
-
23
-
24
-
25
-
26
-
27
-
28
-
29
-
30
-
31
-
32
-
33
-
34
-
35
-
36
-
37
-
38
-
39
-
40
-
41
-
42
-
43
-
44
-
45
-
 46
46 -
 47
47 -
 48
48 -
 49
49 -
 50
50 -
 51
51 -
 52
52 -
 53
53 -
 54
54 -
 55
55 -
 56
56 -
 57
57 -
 58
58 -
 59
59 -
 60
60 -
 61
61 -
 62
62 -
 63
63 -
 64
64 -
 65
65 -
 66
66 -
67
-
68
-
69
-
70
-
71
-
72
-
73
-
74
-
75
-
76
-
77
-
78
-
79
-
80
-
81
-
82
-
83
-
84
-
85
-
86
-
87
-
88
-
89
-
90
-
91
-
92
-
93
-
94
-
95
-
96
-
97
-
98
-
99
-
100
-
101
-
102
-
103
-
104
-
105
-
106
-
107
-
108
-
109
-
110
-
111
-
112
-
113
-
114
-
115
-
116
-
117
-
118
-
119
-
120
-
121
-
122
-
123
-
124
-
125
-
126
-
127
-
128
-
129
-
130
-
131
-
132
-
133
-
134
-
135
-
136
-
137
-
138
-
139
-
140
-
141
-
142
-
143
-
144
-
145
-
146
-
147
-
148
-
149
-
150
-
151
-
152
-
153
-
154
-
155
-
156
-
157
-
158
-
159
-
160
-
161
-
162
-
163
-
164
-
165
-
166
-
167
-
168
-
169
-
170
-
171
-
172
-
173
-
174
-
175
-
176
-
177
-
178
-
179
-
180
-
181
-
182
-
183
-
184
-
185
-
186
-
187
-
188
-
189
-
190
-
191
-
192
-
193
-
194
-
195
-
196
-
197
-
198
-
199
-
200
-
201
-
202
-
203
-
204
-
205
-
206
-
207
-
208
-
209
-
210
-
211
-
212
-
213
-
214
-
215
-
216
-
217
-
218
-
219
-
220
-
221
-
222
-
223
-
224
-
225
-
226
-
227
-
228
-
229
-
230
-
231
-
232
-
233
-
234
-
235
-
236
-
237
-
238
-
239
-
240
-
241
-
242
-
243
-
244
-
245
-
246
-
247
-
248
-
249
-
250
-
251
-
252
-
253
-
254
-
255
-
256
-
257
-
258
-
259
-
260
-
261
-
262
-
263
-
264
-
265
-
266
-
267
-
268
-
269
-
270
-
271
-
272
-
273
-
274
-
275
-
276
-
277
-
278
-
279
-
280
-
281
-
282
-
283
-
284
-
285
-
286
-
287
-
288
-
289
-
290
-
291
-
292
 |
 |

8DEC201015343542
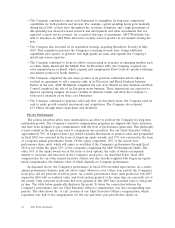
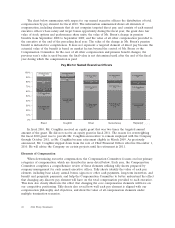
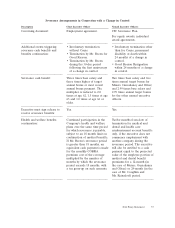
The chart below summarizes with respect to our named executive officers the distribution of total
compensation by pay element for fiscal 2010. The information summarized shows all elements of
compensation, including elements that do not comprise targeted direct pay, and consists of each named
executive officer’s base salary and target bonus opportunity during the fiscal year; the grant date fair
value of stock options and performance share units; the value of Mr. Breen’s change in pension
benefits from September 2008 to September 2009, and the value of all other compensation provided to
the executive at the end of the preceding fiscal year. The value of the change in Mr. Breen’s pension
benefit is included for completeness. It does not represent a targeted element of direct pay because the
actuarial value of the benefit is based on market factors beyond the control of Mr. Breen or the
Compensation Committee. In the case of all other compensation and pension benefit changes, the
previous year’s value is used because the final value is not determined until after the end of the fiscal
year during which the compensation is paid.
FY10 Share-based
Compensation
49%
FY10 Share-based
Compensation
81%
FY10 Share-based
Compensation
59%
FY10 Share-based
Compensation
61%
FY10 Share-based
Compensation
60%
FY10 Target Bonus
11%
FY10 Target Bonus
8%
FY10 Target Bonus
17%
FY10 Target Bonus
17% FY10 Target Bonus
14%
FY09 All Other Comp
6%
FY09 All Other Comp
3%
FY09 All Other Comp
7%
FY09 All Other Comp
5% FY09 All Other Comp
8%
FY09 ∆ Pension Value
25%
FY10 Base Salary
9%
FY10 Base Salary
8% FY10 Base Salary
17%
FY10 Base Salary
17%
FY10 Base Salary
18%
0%
10%
20%
30%
40%
50%
60%
70%
80%
90%
100%
Breen Coughlin Oliver Gursahaney Reinsdorf
Pay Mix for Named Executive Officers
In fiscal 2010, Mr. Coughlin received an equity grant that was two times the targeted annual
amount of the grant. He did not receive an equity grant in fiscal 2011. The reason for overweighting
the fiscal 2010 grant was to provide Mr. Coughlin an incentive to remain employed with the Company
through October 2011, as Mr. Coughlin became retirement eligible in March 2009. As previously
announced, Mr. Coughlin stepped down from the role of Chief Financial Officer effective December 1,
2010. He will advise the Company on certain projects until his retirement in 2011.
Elements of Compensation
When determining executive compensation, the Compensation Committee focuses on four primary
categories of compensation, which are described in more detail below. Each year, the Compensation
Committee completes a comprehensive review of these elements utilizing tally sheets prepared by
company management for each named executive officer. Tally sheets identify the value of each pay
element, including base salary, annual bonus, sign-on or other cash payments, long-term incentives, and
benefit and perquisite payments, and help the Compensation Committee to better understand the effect
that changing any discrete pay element will have on the total compensation provided to each executive.
This data also clearly illustrates the effect that changing the core compensation elements will have on
our competitive positioning. Tally sheets also reveal how well each pay element is aligned with our
compensation philosophy and objectives, and show the value of all compensation elements under
multiple termination scenarios.
48 2011 Proxy Statement