ADT 2010 Annual Report Download - page 75
Download and view the complete annual report
Please find page 75 of the 2010 ADT annual report below. You can navigate through the pages in the report by either clicking on the pages listed below, or by using the keyword search tool below to find specific information within the annual report.-
 1
1 -
2
-
3
-
4
-
5
-
6
-
7
-
8
-
9
-
10
-
11
-
12
-
13
-
14
-
15
-
16
-
17
-
18
-
19
-
20
-
21
-
22
-
23
-
24
-
25
-
26
-
27
-
28
-
29
-
30
-
31
-
32
-
33
-
34
-
35
-
36
-
37
-
38
-
39
-
40
-
41
-
42
-
43
-
44
-
45
-
46
-
47
-
48
-
49
-
50
-
51
-
52
-
53
-
54
-
55
-
56
-
57
-
58
-
59
-
60
-
61
-
62
-
63
-
64
-
 65
65 -
 66
66 -
 67
67 -
 68
68 -
 69
69 -
 70
70 -
 71
71 -
 72
72 -
 73
73 -
 74
74 -
 75
75 -
 76
76 -
 77
77 -
 78
78 -
 79
79 -
 80
80 -
 81
81 -
 82
82 -
 83
83 -
 84
84 -
 85
85 -
86
-
87
-
88
-
89
-
90
-
91
-
92
-
93
-
94
-
95
-
96
-
97
-
98
-
99
-
100
-
101
-
102
-
103
-
104
-
105
-
106
-
107
-
108
-
109
-
110
-
111
-
112
-
113
-
114
-
115
-
116
-
117
-
118
-
119
-
120
-
121
-
122
-
123
-
124
-
125
-
126
-
127
-
128
-
129
-
130
-
131
-
132
-
133
-
134
-
135
-
136
-
137
-
138
-
139
-
140
-
141
-
142
-
143
-
144
-
145
-
146
-
147
-
148
-
149
-
150
-
151
-
152
-
153
-
154
-
155
-
156
-
157
-
158
-
159
-
160
-
161
-
162
-
163
-
164
-
165
-
166
-
167
-
168
-
169
-
170
-
171
-
172
-
173
-
174
-
175
-
176
-
177
-
178
-
179
-
180
-
181
-
182
-
183
-
184
-
185
-
186
-
187
-
188
-
189
-
190
-
191
-
192
-
193
-
194
-
195
-
196
-
197
-
198
-
199
-
200
-
201
-
202
-
203
-
204
-
205
-
206
-
207
-
208
-
209
-
210
-
211
-
212
-
213
-
214
-
215
-
216
-
217
-
218
-
219
-
220
-
221
-
222
-
223
-
224
-
225
-
226
-
227
-
228
-
229
-
230
-
231
-
232
-
233
-
234
-
235
-
236
-
237
-
238
-
239
-
240
-
241
-
242
-
243
-
244
-
245
-
246
-
247
-
248
-
249
-
250
-
251
-
252
-
253
-
254
-
255
-
256
-
257
-
258
-
259
-
260
-
261
-
262
-
263
-
264
-
265
-
266
-
267
-
268
-
269
-
270
-
271
-
272
-
273
-
274
-
275
-
276
-
277
-
278
-
279
-
280
-
281
-
282
-
283
-
284
-
285
-
286
-
287
-
288
-
289
-
290
-
291
-
292
 |
 |

2011 Proxy Statement 67
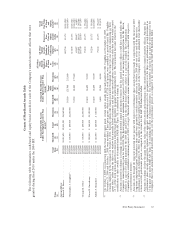
Grants of Plan-Based Awards Table
The following table summarizes cash-based and equity based awards for each of the Company’s named executive officers that were
granted during fiscal 2010 under the 2004 SIP.
All Other
Stock All Other Grant
Estimated Possible Payouts Estimated Possible Payouts Awards: Option Date
Under Non-Equity Incentive Plan Under Equity Incentive Plan Number of Awards: Exercise or Fair Value
Awards(2) Awards(3)
Shares Number of Base of Stock
Target of Stock Securities Price of and
(Mid- or Underlying Option Option
Grant Threshold Target Maximum Threshold Point) Maximum Units Options Awards Awards(4)
Name Date ($) ($) ($) (#) (#) (#) (#) (#) ($/Sh) ($)
(a) (b) (c) (d) (e) (f) (g) (h) (i) (j) (k) (l)
Current Officers
Edward D. Breen ............... 12/9/2009 $1,015,625 $2,031,250 $4,062,500
10/1/2009 449,700 $33.75 $4,515,932
10/1/2009 50,360 125,900 251,800 $4,419,090
Christopher J. Coughlin(1) .......... 12/9/2009 $ 400,000 $ 800,000 $1,600,000
10/1/2009 317,400 $33.75 $3,187,363
10/1/2009 35,520 88,800 177,600 $3,416,580
10/1/2009 62,187 $46.07 $ 63,823
10/1/2009 188,841 $48.14 $ 349,564
10/1/2009 184,700 $29.00 $ 897,199
George R. Oliver ............... 12/9/2009 $ 300,000 $ 600,000 $1,200,000
10/1/2009 95,200 $33.75 $ 956,008
10/1/2009 10,640 26,600 53,200 $1,104,233
Naren K. Gursahaney ............ 12/9/2009 $ 280,000 $ 560,000 $1,120,000
10/1/2009 95,200 $33.75 $ 956,008
10/1/2009 10,640 26,600 53,200 $1,104,233
Judith A. Reinsdorf ............. 12/9/2009 $ 210,000 $ 420,000 $ 840,000
10/1/2009 79,300 $33.75 $ 796,339
10/1/2009 8,880 22,200 44,400 $ 921,578
(1) On October 1, 2009, in connection with the fiscal 2010 equity grant, certain option awards previously granted to Mr. Coughlin on November 22, 2005,
November 21, 2006 and October 7, 2008 were modified. These prior grants, which total 435,728 stock options, were modified to provide that if Mr. Coughlin
remains employed by the Company on October 8, 2011, then the options will remain exercisable throughout the entire ten-year period commencing on their
grant dates, rather than the three-year window that normally follows retirement, and that any unvested options outstanding on such date (which would consist
of 1⁄4 of the stock options granted in connection with the fiscal 2009 incentive program) would immediately vest. The incremental fair value related to the
modification of these awards, as determined under FASB ASC Topic 718, is included in column (l).
(2) Amounts reported in columns (c) through (e) represent potential annual performance bonuses that the named executive officers could have earned under the
Company’s annual incentive plan for fiscal 2010. The Board approved a maximum bonus payout of 0.50% of net income before special items for Mr. Breen,
subject to a cap of $5.0 million imposed by the 2004 SIP, and 0.25% for the other Senior Officers, subject to a cap of $2.5 million. The Compensation
Committee further established a maximum payout of 200% of target. Threshold amounts assume minimum performance levels are achieved with respect to
each performance measure.
(3) Amounts in (f) through (h) represent potential share payouts with respect to performance share awards that were made in connection with the fiscal year 2010
long-term compensation grant. Performance share units were granted to certain executive officers in October 2009 and vest at the end of the three-year
performance period on September 30, 2012. The number of shares that will be paid out will depend on the Company’s three-year annualized total shareholder
return over the performance period, as compared to the return for the S&P 500 Industrials Index.
(4) Amounts in column (l) show the grant date fair value of the option awards and performance share awards granted to named executive officers. Amounts for
performance share awards represent the estimate of the aggregate compensation cost to be recognized over the three year performance period determined as
of the grant date under FASB ASC Topic 718, excluding the effect of estimated forfeitures. The actual number of shares that are paid out will depend on the
Company’s three-year annualized total shareholder return over the performance period, as compared to the return for the S&P 500 Industrials Index.