ADT 2010 Annual Report Download - page 267
Download and view the complete annual report
Please find page 267 of the 2010 ADT annual report below. You can navigate through the pages in the report by either clicking on the pages listed below, or by using the keyword search tool below to find specific information within the annual report.-
 1
1 -
2
-
3
-
4
-
5
-
6
-
7
-
8
-
9
-
10
-
11
-
12
-
13
-
14
-
15
-
16
-
17
-
18
-
19
-
20
-
21
-
22
-
23
-
24
-
25
-
26
-
27
-
28
-
29
-
30
-
31
-
32
-
33
-
34
-
35
-
36
-
37
-
38
-
39
-
40
-
41
-
42
-
43
-
44
-
45
-
46
-
47
-
48
-
49
-
50
-
51
-
52
-
53
-
54
-
55
-
56
-
57
-
58
-
59
-
60
-
61
-
62
-
63
-
64
-
65
-
66
-
67
-
68
-
69
-
70
-
71
-
72
-
73
-
74
-
75
-
76
-
77
-
78
-
79
-
80
-
81
-
82
-
83
-
84
-
85
-
86
-
87
-
88
-
89
-
90
-
91
-
92
-
93
-
94
-
95
-
96
-
97
-
98
-
99
-
100
-
101
-
102
-
103
-
104
-
105
-
106
-
107
-
108
-
109
-
110
-
111
-
112
-
113
-
114
-
115
-
116
-
117
-
118
-
119
-
120
-
121
-
122
-
123
-
124
-
125
-
126
-
127
-
128
-
129
-
130
-
131
-
132
-
133
-
134
-
135
-
136
-
137
-
138
-
139
-
140
-
141
-
142
-
143
-
144
-
145
-
146
-
147
-
148
-
149
-
150
-
151
-
152
-
153
-
154
-
155
-
156
-
157
-
158
-
159
-
160
-
161
-
162
-
163
-
164
-
165
-
166
-
167
-
168
-
169
-
170
-
171
-
172
-
173
-
174
-
175
-
176
-
177
-
178
-
179
-
180
-
181
-
182
-
183
-
184
-
185
-
186
-
187
-
188
-
189
-
190
-
191
-
192
-
193
-
194
-
195
-
196
-
197
-
198
-
199
-
200
-
201
-
202
-
203
-
204
-
205
-
206
-
207
-
208
-
209
-
210
-
211
-
212
-
213
-
214
-
215
-
216
-
217
-
218
-
219
-
220
-
221
-
222
-
223
-
224
-
225
-
226
-
227
-
228
-
229
-
230
-
231
-
232
-
233
-
234
-
235
-
236
-
237
-
238
-
239
-
240
-
241
-
242
-
243
-
244
-
245
-
246
-
247
-
248
-
249
-
250
-
251
-
252
-
253
-
254
-
255
-
256
-
 257
257 -
 258
258 -
 259
259 -
 260
260 -
 261
261 -
 262
262 -
 263
263 -
 264
264 -
 265
265 -
 266
266 -
 267
267 -
 268
268 -
 269
269 -
 270
270 -
 271
271 -
 272
272 -
 273
273 -
 274
274 -
 275
275 -
 276
276 -
 277
277 -
278
-
279
-
280
-
281
-
282
-
283
-
284
-
285
-
286
-
287
-
288
-
289
-
290
-
291
-
292
 |
 |

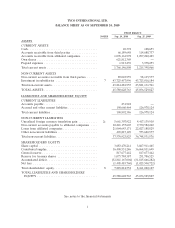
TYCO INTERNATIONAL LTD.
BALANCE SHEET AS OF SEPTEMBER 24, 2010
SWISS FRANCS
NOTES Sep. 24, 2010 Sep. 25, 2009
ASSETS
CURRENT ASSETS
Cash ........................................ 69,374 128,653
Accounts receivable from third parties ............... 66,189,648 114,688,737
Accounts receivable from affiliated companies .......... 1,076,161,978 1,097,202,423
Own shares ................................... 621,812,369 —
Prepaid expenses ............................... 1,913,439 3,378,253
Total current assets ............................. 1,766,146,808 1,215,398,066
NON-CURRENT ASSETS
Non-current accounts receivable from third parties ...... 89,023,959 98,115,577
Investment in subsidiaries ........................ 7 43,725,457,996 43,723,016,184
Total non-current assets .......................... 43,814,481,955 43,821,131,761
TOTAL ASSETS ............................... 45,580,628,763 45,036,529,827
LIABILITIES AND SHAREHOLDERS’ EQUITY
CURRENT LIABILITIES
Accounts payable ............................... 231,922 —
Accrued and other current liabilities ................. 190,660,464 126,978,124
Total current liabilities ........................... 190,892,386 126,978,124
NON-CURRENT LIABILITIES
Unrealized foreign currency translation gain ........... 2c 5,661,307,922 4,417,139,910
Non-current accounts payable to affiliated companies .... 10,441,157,603 9,730,582,260
Loans from affiliated companies .................... 21,064,643,171 22,027,188,829
Other non-current liabilities ....................... 403,815,129 573,620,577
Total non-current liabilities ........................ 37,570,923,825 36,748,531,576
SHAREHOLDERS’ EQUITY
Share capital .................................. 3,683,470,241 3,867,911,465
Contributed surplus ............................. 36,490,531,246 36,064,811,699
General reserve ................................ 817,677,442 817,677,442
Reserve for treasury shares ....................... 1,073,784,387 251,786,525
Accumulated deficit ............................. (32,841,167,004) (31,815,666,282)
Net loss ..................................... (1,405,483,760) (1,025,500,722)
Total shareholders’ equity ......................... 8 7,818,812,552 8,161,020,127
TOTAL LIABILITIES AND SHAREHOLDERS’
EQUITY ................................... 45,580,628,763 45,036,529,827
See notes to the financial statements
1