ADT 2010 Annual Report Download - page 118
Download and view the complete annual report
Please find page 118 of the 2010 ADT annual report below. You can navigate through the pages in the report by either clicking on the pages listed below, or by using the keyword search tool below to find specific information within the annual report.-
 1
1 -
2
-
3
-
4
-
5
-
6
-
7
-
8
-
9
-
10
-
11
-
12
-
13
-
14
-
15
-
16
-
17
-
18
-
19
-
20
-
21
-
22
-
23
-
24
-
25
-
26
-
27
-
28
-
29
-
30
-
31
-
32
-
33
-
34
-
35
-
36
-
37
-
38
-
39
-
40
-
41
-
42
-
43
-
44
-
45
-
46
-
47
-
48
-
49
-
50
-
51
-
52
-
53
-
54
-
55
-
56
-
57
-
58
-
59
-
60
-
61
-
62
-
63
-
64
-
65
-
66
-
67
-
68
-
69
-
70
-
71
-
72
-
73
-
74
-
75
-
76
-
77
-
78
-
79
-
80
-
81
-
82
-
83
-
84
-
85
-
86
-
87
-
88
-
89
-
90
-
91
-
92
-
93
-
94
-
95
-
96
-
97
-
98
-
99
-
100
-
101
-
102
-
103
-
104
-
105
-
106
-
107
-
 108
108 -
 109
109 -
 110
110 -
 111
111 -
 112
112 -
 113
113 -
 114
114 -
 115
115 -
 116
116 -
 117
117 -
 118
118 -
 119
119 -
 120
120 -
 121
121 -
 122
122 -
 123
123 -
 124
124 -
 125
125 -
 126
126 -
 127
127 -
 128
128 -
129
-
130
-
131
-
132
-
133
-
134
-
135
-
136
-
137
-
138
-
139
-
140
-
141
-
142
-
143
-
144
-
145
-
146
-
147
-
148
-
149
-
150
-
151
-
152
-
153
-
154
-
155
-
156
-
157
-
158
-
159
-
160
-
161
-
162
-
163
-
164
-
165
-
166
-
167
-
168
-
169
-
170
-
171
-
172
-
173
-
174
-
175
-
176
-
177
-
178
-
179
-
180
-
181
-
182
-
183
-
184
-
185
-
186
-
187
-
188
-
189
-
190
-
191
-
192
-
193
-
194
-
195
-
196
-
197
-
198
-
199
-
200
-
201
-
202
-
203
-
204
-
205
-
206
-
207
-
208
-
209
-
210
-
211
-
212
-
213
-
214
-
215
-
216
-
217
-
218
-
219
-
220
-
221
-
222
-
223
-
224
-
225
-
226
-
227
-
228
-
229
-
230
-
231
-
232
-
233
-
234
-
235
-
236
-
237
-
238
-
239
-
240
-
241
-
242
-
243
-
244
-
245
-
246
-
247
-
248
-
249
-
250
-
251
-
252
-
253
-
254
-
255
-
256
-
257
-
258
-
259
-
260
-
261
-
262
-
263
-
264
-
265
-
266
-
267
-
268
-
269
-
270
-
271
-
272
-
273
-
274
-
275
-
276
-
277
-
278
-
279
-
280
-
281
-
282
-
283
-
284
-
285
-
286
-
287
-
288
-
289
-
290
-
291
-
292
 |
 |
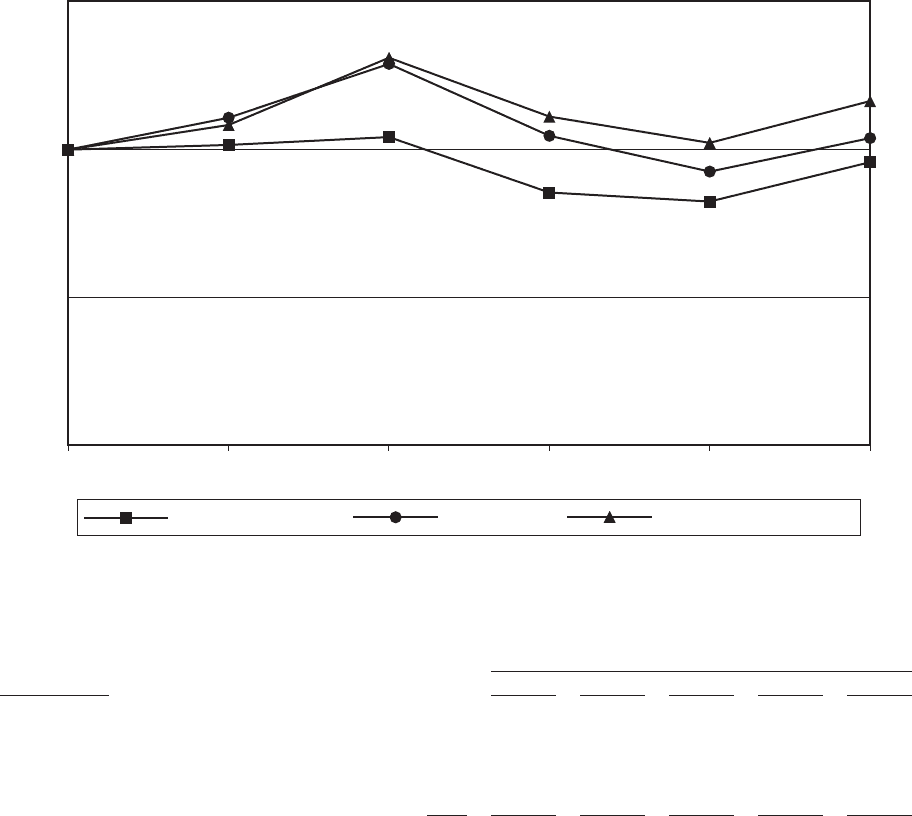
20DEC201018280626
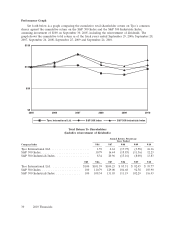
Performance Graph
Set forth below is a graph comparing the cumulative total shareholder return on Tyco’s common
shares against the cumulative return on the S&P 500 Index and the S&P 500 Industrials Index,
assuming investment of $100 on September 30, 2005, including the reinvestment of dividends. The
graph shows the cumulative total return as of the fiscal years ended September 29, 2006, September 28,
2007, September 26, 2008, September 25, 2009 and September 24, 2010.
$0
$50
$100
$150
2005 2006 2007 2008 2009 2010
S&P 500 Industrials Index
S&P 500 Index
Tyco International Ltd.
Total Return To Shareholders
(Includes reinvestment of dividends)
Annual Return Percentage
Years Ended
Company/Index 9/06 9/07 9/08 9/09 9/10
Tyco International Ltd. ...................... 1.59 2.61 (17.97) (3.58) 16.16
S&P 500 Index ............................ 10.79 16.44 (18.85) (11.56) 12.23
S&P 500 Industrials Index .................... 8.34 20.96 (15.16) (8.00) 13.83
9/05 9/06 9/07 9/08 9/09 9/10
Tyco International Ltd. ................ $100 $101.59 $104.25 $ 85.51 $ 82.45 $ 95.77
S&P 500 Index ...................... 100 110.79 129.00 104.68 92.58 103.90
S&P 500 Industrials Index .............. 100 108.34 131.05 111.19 102.29 116.43
30 2010 Financials