ADT 2010 Annual Report Download - page 207
Download and view the complete annual report
Please find page 207 of the 2010 ADT annual report below. You can navigate through the pages in the report by either clicking on the pages listed below, or by using the keyword search tool below to find specific information within the annual report.-
 1
1 -
2
-
3
-
4
-
5
-
6
-
7
-
8
-
9
-
10
-
11
-
12
-
13
-
14
-
15
-
16
-
17
-
18
-
19
-
20
-
21
-
22
-
23
-
24
-
25
-
26
-
27
-
28
-
29
-
30
-
31
-
32
-
33
-
34
-
35
-
36
-
37
-
38
-
39
-
40
-
41
-
42
-
43
-
44
-
45
-
46
-
47
-
48
-
49
-
50
-
51
-
52
-
53
-
54
-
55
-
56
-
57
-
58
-
59
-
60
-
61
-
62
-
63
-
64
-
65
-
66
-
67
-
68
-
69
-
70
-
71
-
72
-
73
-
74
-
75
-
76
-
77
-
78
-
79
-
80
-
81
-
82
-
83
-
84
-
85
-
86
-
87
-
88
-
89
-
90
-
91
-
92
-
93
-
94
-
95
-
96
-
97
-
98
-
99
-
100
-
101
-
102
-
103
-
104
-
105
-
106
-
107
-
108
-
109
-
110
-
111
-
112
-
113
-
114
-
115
-
116
-
117
-
118
-
119
-
120
-
121
-
122
-
123
-
124
-
125
-
126
-
127
-
128
-
129
-
130
-
131
-
132
-
133
-
134
-
135
-
136
-
137
-
138
-
139
-
140
-
141
-
142
-
143
-
144
-
145
-
146
-
147
-
148
-
149
-
150
-
151
-
152
-
153
-
154
-
155
-
156
-
157
-
158
-
159
-
160
-
161
-
162
-
163
-
164
-
165
-
166
-
167
-
168
-
169
-
170
-
171
-
172
-
173
-
174
-
175
-
176
-
177
-
178
-
179
-
180
-
181
-
182
-
183
-
184
-
185
-
186
-
187
-
188
-
189
-
190
-
191
-
192
-
193
-
194
-
195
-
196
-
 197
197 -
 198
198 -
 199
199 -
 200
200 -
 201
201 -
 202
202 -
 203
203 -
 204
204 -
 205
205 -
 206
206 -
 207
207 -
 208
208 -
 209
209 -
 210
210 -
 211
211 -
 212
212 -
 213
213 -
 214
214 -
 215
215 -
 216
216 -
 217
217 -
218
-
219
-
220
-
221
-
222
-
223
-
224
-
225
-
226
-
227
-
228
-
229
-
230
-
231
-
232
-
233
-
234
-
235
-
236
-
237
-
238
-
239
-
240
-
241
-
242
-
243
-
244
-
245
-
246
-
247
-
248
-
249
-
250
-
251
-
252
-
253
-
254
-
255
-
256
-
257
-
258
-
259
-
260
-
261
-
262
-
263
-
264
-
265
-
266
-
267
-
268
-
269
-
270
-
271
-
272
-
273
-
274
-
275
-
276
-
277
-
278
-
279
-
280
-
281
-
282
-
283
-
284
-
285
-
286
-
287
-
288
-
289
-
290
-
291
-
292
 |
 |
TYCO INTERNATIONAL LTD.
NOTES TO CONSOLIDATED FINANCIAL STATEMENTS
11. Debt (Continued)
the principal amount of the notes tendered, plus accrued and unpaid interest. Otherwise, the notes
mature on January 15, 2019. Debt issuance costs will be amortized from the date of issuance to the
earliest redemption date, which is July 15, 2014. Interest is payable semiannually on January 15th and
July 15th. The interest rate payable on the 2019 notes is subject to escalations, as defined by the
Indenture, if either Moody’s or S&P downgrades the Company’s debt rating below investment grade.
The 2019 notes will not be subject to the preceding adjustments if at any time the Company’s debt
rating increases to A3 and A- for Moody’s and S&P, respectively.
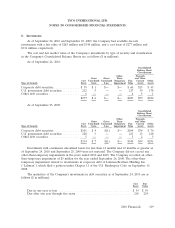
On January 15, 2009, TIFSA made a payment of $215 million to extinguish all of its 6.125% notes,
due 2009 which matured on the same date. Additionally, in November 2008, TIFSA made a payment of
$300 million to extinguish all of its 6.125% notes due 2008.
Other Debt Information
The aggregate amounts of principal debt, including capital leases, maturing during the next five
years and thereafter are as follows ($ in millions): $537 in 2011, $5 in 2012, $5 in 2013, $662 in 2014,
$506 in 2015 and $2,414 thereafter.
The weighted-average interest rate on total debt was 6.3% and 6.6% as of September 24, 2010 and
September 25, 2009, respectively, excluding the impact of interest rate swaps. The weighted-average
interest rate on short-term debt was 6.8% and 0.3% as of September 24, 2010 and September 25, 2009,
respectively. As of September 24, 2010 and September 25, 2009, the Company had swapped an
aggregate of approximately $1.5 billion and $1.4 billion, respectively, of fixed for floating rate debt. The
impact of the Company’s interest rate swap agreements on reported interest expense was a net
decrease of $24 million for 2010, a net decrease of $6 million for 2009 and was not material for 2008.
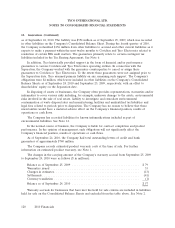
12. Guarantees
Certain of the Company’s business segments have guaranteed the performance of third-parties and
provided financial guarantees for uncompleted work and financial commitments. The terms of these
guarantees vary with end dates ranging from the current fiscal year through the completion of such
transactions. The guarantees would typically be triggered in the event of nonperformance and
performance under the guarantees, if required, would not have a material effect on the Company’s
financial position, results of operations or cash flows.
There are certain guarantees or indemnifications extended among Tyco, Covidien and Tyco
Electronics in accordance with the terms of the Separation and Distribution Agreement and the Tax
Sharing Agreement. The guarantees primarily relate to certain contingent tax liabilities included in the
Tax Sharing Agreement. At the time of the Separation, Tyco recorded a liability necessary to recognize
the fair value of such guarantees and indemnifications. In the absence of observable transactions for
identical or similar guarantees, the Company determined the fair value of these guarantees and
indemnifications utilizing expected present value measurement techniques. Significant assumptions
utilized to determine fair value included determining a range of potential outcomes, assigning a
probability weighting to each potential outcome and estimating the anticipated timing of resolution.
The probability weighted outcomes were discounted using the Company’s incremental borrowing rate.
The liability necessary to reflect the fair value of guarantees and indemnifications under the Tax
Sharing Agreement is $554 million (of which $156 million is included in accrued and other current
liabilities and the remaining amount in other liabilities) on the Company’s Consolidated Balance Sheet
2010 Financials 119