ADT 2010 Annual Report Download - page 73
Download and view the complete annual report
Please find page 73 of the 2010 ADT annual report below. You can navigate through the pages in the report by either clicking on the pages listed below, or by using the keyword search tool below to find specific information within the annual report.-
 1
1 -
2
-
3
-
4
-
5
-
6
-
7
-
8
-
9
-
10
-
11
-
12
-
13
-
14
-
15
-
16
-
17
-
18
-
19
-
20
-
21
-
22
-
23
-
24
-
25
-
26
-
27
-
28
-
29
-
30
-
31
-
32
-
33
-
34
-
35
-
36
-
37
-
38
-
39
-
40
-
41
-
42
-
43
-
44
-
45
-
46
-
47
-
48
-
49
-
50
-
51
-
52
-
53
-
54
-
55
-
56
-
57
-
58
-
59
-
60
-
61
-
62
-
 63
63 -
 64
64 -
 65
65 -
 66
66 -
 67
67 -
 68
68 -
 69
69 -
 70
70 -
 71
71 -
 72
72 -
 73
73 -
 74
74 -
 75
75 -
 76
76 -
 77
77 -
 78
78 -
 79
79 -
 80
80 -
 81
81 -
 82
82 -
 83
83 -
84
-
85
-
86
-
87
-
88
-
89
-
90
-
91
-
92
-
93
-
94
-
95
-
96
-
97
-
98
-
99
-
100
-
101
-
102
-
103
-
104
-
105
-
106
-
107
-
108
-
109
-
110
-
111
-
112
-
113
-
114
-
115
-
116
-
117
-
118
-
119
-
120
-
121
-
122
-
123
-
124
-
125
-
126
-
127
-
128
-
129
-
130
-
131
-
132
-
133
-
134
-
135
-
136
-
137
-
138
-
139
-
140
-
141
-
142
-
143
-
144
-
145
-
146
-
147
-
148
-
149
-
150
-
151
-
152
-
153
-
154
-
155
-
156
-
157
-
158
-
159
-
160
-
161
-
162
-
163
-
164
-
165
-
166
-
167
-
168
-
169
-
170
-
171
-
172
-
173
-
174
-
175
-
176
-
177
-
178
-
179
-
180
-
181
-
182
-
183
-
184
-
185
-
186
-
187
-
188
-
189
-
190
-
191
-
192
-
193
-
194
-
195
-
196
-
197
-
198
-
199
-
200
-
201
-
202
-
203
-
204
-
205
-
206
-
207
-
208
-
209
-
210
-
211
-
212
-
213
-
214
-
215
-
216
-
217
-
218
-
219
-
220
-
221
-
222
-
223
-
224
-
225
-
226
-
227
-
228
-
229
-
230
-
231
-
232
-
233
-
234
-
235
-
236
-
237
-
238
-
239
-
240
-
241
-
242
-
243
-
244
-
245
-
246
-
247
-
248
-
249
-
250
-
251
-
252
-
253
-
254
-
255
-
256
-
257
-
258
-
259
-
260
-
261
-
262
-
263
-
264
-
265
-
266
-
267
-
268
-
269
-
270
-
271
-
272
-
273
-
274
-
275
-
276
-
277
-
278
-
279
-
280
-
281
-
282
-
283
-
284
-
285
-
286
-
287
-
288
-
289
-
290
-
291
-
292
 |
 |

Amounts in column (f) for Mr. Coughlin include the incremental fair value of certain
modifications made to outstanding options in connection with the fiscal 2010 equity grant. These
prior grants, which total 435,728 stock options, were made as part of the fiscal 2006, 2007 and 2009
annual equity incentive program. The awards were modified to provide that if Mr. Coughlin
remains employed by the Company on October 8, 2011, then the options will remain exercisable
throughout the entire ten-year period commencing on their grant dates, rather than the three-year
window that normally follows retirement, and that any unvested options outstanding on such date
(which would consist of 1⁄4 of the stock options granted in connection with the fiscal 2009 incentive
program) would immediately vest.
(3) Non-Equity Incentive Plan Compensation: The amounts reported in column (g) for each named
executive officer reflect annual cash incentive compensation for the applicable fiscal year. Annual
incentive compensation is discussed in further detail above under the heading ‘‘Elements of
Compensation—Annual Incentive Compensation.’’
(4) Change in Pension Value and Non-Qualified Deferred Compensation Earnings: The amounts
reported in column (h) for Mr. Breen reflect the aggregate increase in the actuarial present value
of his accumulated benefits under all pension plans during fiscal 2010, 2009 and 2008, determined
using interest rate and mortality rate assumptions consistent with those used in the Company’s
financial statements. Information regarding the pension plans is set forth in further detail below
following the ‘‘Pension Benefits’’ table.
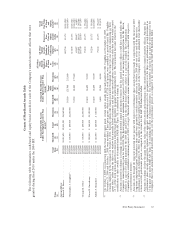
(5) All Other Compensation: The amounts reported in column (i) for each named executive officer
represent cash perquisites, insurance premiums paid by the Company for the benefit of the officer
(and, in some cases, the officer’s spouse), costs related to personal use of Company aircraft, tax
gross-up payments, Company contributions to 401(k) plans and non-qualified plans of the
Company and its subsidiaries providing similar benefits, and other miscellaneous benefits. The
components of All Other Compensation for each named executive officer are shown in the
following table.
Supplemental Executive Insurance
Benefits(b) Personal
Variable Use of Retirement Total All
Fiscal Cash Universal Supplemental Long-Term Company Tax Plan Other
Named Executive Year Perquisite(a) Life Disability Care Aircraft(c) Gross-Ups(d) Contributions(e) Miscellaneous(f) Compensation
Current Officers
Edward D. Breen ..... 2010 $70,000 $50,405 $34,683 $15,429 $213,151 $841,566 $174,117 — $1,399,351
2009 $70,000 $50,405 $37,689 $15,428 $238,795 $478,964 $236,396 — $1,127,677
2008 $70,000 $50,405 $36,021 $15,429 $246,347 $632,091 $243,083 $ 307 $1,293,683
Christopher J. Coughlin . 2010 $70,000 $28,262 $17,990 $21,211 $ 39,302 $ 43,471 $ 76,800 $10,190 $ 307,226
2009 $70,000 $28,262 $17,990 $21,210 — $ 39,959 $116,667 $15,100 $ 309,188
2008 $70,000 $28,262 $17,990 $21,211 — $ 64,375 $120,250 $10,109 $ 332,197
George R. Oliver ..... 2010 $60,000 $14,839 $14,837 $20,347 — $ 19,392 $ 36,149 $10,000 $ 175,564
2009 $60,000 $14,839 $14,837 $20,346 — $ 21,011 $ 84,049 $16,750 $ 231,832
2008 $59,375 $14,839 $17,248 $20,347 — $ 18,617 $ 71,478 $11,207 $ 213,111
Naren K. Gursahaney . . 2010 $56,000 $10,109 $15,008 $19,275 — $ 23,607 $ 43,475 $ 9,500 $ 176,974
2009 $56,000 $10,109 $15,008 $19,274 — $ 23,782 $ 57,567 $ 7,369 $ 189,109
2008 $56,000 $10,109 $17,418 $19,275 — $ 21,700 $ 72,000 $ 3,125 $ 199,627
Judith A. Reinsdorf . . . 2010 $52,500 $ 9,681 $12,762 $29,783 — $ 26,593 $ 44,133 $10,000 $ 185,452
(a) Cash Perquisites reflect an annual cash perquisite payment equal to the lesser of 10% of the
executive’s base salary and $70,000. Payments are made quarterly and are adjusted to reflect
changes in salary.
(b) Supplemental Executive Insurance Benefits reflect premiums paid by the Company for insurance
benefits for the executive and, in the case of long-term care, for the executive’s spouse as well.
These benefits are provided to certain Senior Officers of the Company upon the approval of the
Compensation Committee.
(c) For security purposes, the Chief Executive Officer is authorized to use Company-owned or -leased
aircraft for personal travel. Other named executive officers are permitted to use Company-owned
or -leased aircraft if expressly approved by the Board or Mr. Breen. For purposes of the Summary
2011 Proxy Statement 65