ADT 2010 Annual Report Download - page 131
Download and view the complete annual report
Please find page 131 of the 2010 ADT annual report below. You can navigate through the pages in the report by either clicking on the pages listed below, or by using the keyword search tool below to find specific information within the annual report.-
 1
1 -
2
-
3
-
4
-
5
-
6
-
7
-
8
-
9
-
10
-
11
-
12
-
13
-
14
-
15
-
16
-
17
-
18
-
19
-
20
-
21
-
22
-
23
-
24
-
25
-
26
-
27
-
28
-
29
-
30
-
31
-
32
-
33
-
34
-
35
-
36
-
37
-
38
-
39
-
40
-
41
-
42
-
43
-
44
-
45
-
46
-
47
-
48
-
49
-
50
-
51
-
52
-
53
-
54
-
55
-
56
-
57
-
58
-
59
-
60
-
61
-
62
-
63
-
64
-
65
-
66
-
67
-
68
-
69
-
70
-
71
-
72
-
73
-
74
-
75
-
76
-
77
-
78
-
79
-
80
-
81
-
82
-
83
-
84
-
85
-
86
-
87
-
88
-
89
-
90
-
91
-
92
-
93
-
94
-
95
-
96
-
97
-
98
-
99
-
100
-
101
-
102
-
103
-
104
-
105
-
106
-
107
-
108
-
109
-
110
-
111
-
112
-
113
-
114
-
115
-
116
-
117
-
118
-
119
-
120
-
 121
121 -
 122
122 -
 123
123 -
 124
124 -
 125
125 -
 126
126 -
 127
127 -
 128
128 -
 129
129 -
 130
130 -
 131
131 -
 132
132 -
 133
133 -
 134
134 -
 135
135 -
 136
136 -
 137
137 -
 138
138 -
 139
139 -
 140
140 -
 141
141 -
142
-
143
-
144
-
145
-
146
-
147
-
148
-
149
-
150
-
151
-
152
-
153
-
154
-
155
-
156
-
157
-
158
-
159
-
160
-
161
-
162
-
163
-
164
-
165
-
166
-
167
-
168
-
169
-
170
-
171
-
172
-
173
-
174
-
175
-
176
-
177
-
178
-
179
-
180
-
181
-
182
-
183
-
184
-
185
-
186
-
187
-
188
-
189
-
190
-
191
-
192
-
193
-
194
-
195
-
196
-
197
-
198
-
199
-
200
-
201
-
202
-
203
-
204
-
205
-
206
-
207
-
208
-
209
-
210
-
211
-
212
-
213
-
214
-
215
-
216
-
217
-
218
-
219
-
220
-
221
-
222
-
223
-
224
-
225
-
226
-
227
-
228
-
229
-
230
-
231
-
232
-
233
-
234
-
235
-
236
-
237
-
238
-
239
-
240
-
241
-
242
-
243
-
244
-
245
-
246
-
247
-
248
-
249
-
250
-
251
-
252
-
253
-
254
-
255
-
256
-
257
-
258
-
259
-
260
-
261
-
262
-
263
-
264
-
265
-
266
-
267
-
268
-
269
-
270
-
271
-
272
-
273
-
274
-
275
-
276
-
277
-
278
-
279
-
280
-
281
-
282
-
283
-
284
-
285
-
286
-
287
-
288
-
289
-
290
-
291
-
292
 |
 |

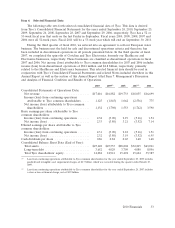
recorded at the Electrical and Metal Products reporting unit. Also contributing to the increase in
operating income were higher spreads for steel products resulting from lower raw material costs which
more than offset lower selling prices. These increases in operating income were partially offset by lower
volumes as well as higher raw material costs which more than offset higher selling prices for armor
cable products. During 2010, $13 million of restructuring charges were incurred compared to
$21 million of restructuring and divestiture charges during 2009. Additionally, $1 million of additional
charges resulting from restructuring actions were incurred during 2009 as compared to no additional
charges during 2010.
Net revenue for Electrical and Metal Products decreased $880 million, or 38.7%, in 2009 as
compared to 2008. The decrease in revenue was primarily due to lower volume and selling prices of
steel products largely resulting from a decline in the commercial market in North America. Lower
volume and selling prices for armored cable products also contributed to the decline. Changes in
foreign currency exchange rates had an unfavorable impact of $52 million, or 2.3%. The net impact of
acquisitions and divestitures negatively affected revenue by approximately $31 million, or 1.4%.
Operating income decreased $1.3 billion in 2009 as compared to 2008. Based on the sales volume
decrease as well as the significant decline in the price of steel, the Company recorded a goodwill
impairment charge of $935 million during the second quarter of 2009. There was no goodwill
impairment recorded during 2008. The decrease in operating income also related to volume declines as
well as lower spreads for steel products. Spreads for steel products continued to decline as a direct
result of higher raw material costs and lower selling prices. Lower restructuring and divestiture charges
incurred in 2009 as compared to similar charges incurred in 2008 partially offset the decline in
operating income discussed above. Results for 2009 included restructuring and divestiture charges of
$21 million as compared to $42 million for 2008. Additionally, management estimates that $1 million of
additional charges resulting from restructuring actions were incurred during 2009.
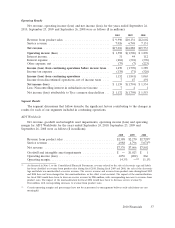
Safety Products
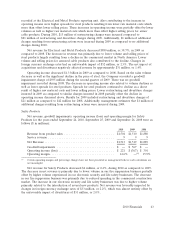
Net revenue, goodwill impairments, operating income (loss) and operating margin for Safety
Products for the years ended September 24, 2010, September 25, 2009 and September 26, 2008 were as
follows ($ in millions):
2010 2009 2008
Revenue from product sales ............................. $1,504 $1,510 $1,880
Service revenue ......................................999
Net Revenue ........................................ $1,513 $1,519 $1,889
Goodwill impairments ................................. $ — $ 567 $ —
Operating income (loss) ................................ $ 221 $(367) $ 301
Operating margin ..................................... 14.6% —(1) 15.9%
(1) Certain operating margins and percentage changes have not been presented as management believes such calculations are
not meaningful.
Net revenue for Safety Products decreased $6 million, or 0.4%, during 2010 as compared to 2009.
The decrease in net revenue is primarily due to lower volume in our fire suppression business partially
offset by higher volume experienced in our electronic security and life safety businesses. The decrease
in our fire suppression business was primarily due to reduced spending in the commercial construction
market. The increase in our electronic security and life safety businesses was due to higher volume
primarily related to the introduction of several new products. Net revenue was favorably impacted by
changes in foreign currency exchange rates of $33 million, or 2.2%, which was almost entirely offset by
the unfavorable impact of divestitures of $31 million, or 2.0%.
2010 Financials 43