ADT 2010 Annual Report Download - page 191
Download and view the complete annual report
Please find page 191 of the 2010 ADT annual report below. You can navigate through the pages in the report by either clicking on the pages listed below, or by using the keyword search tool below to find specific information within the annual report.-
 1
1 -
2
-
3
-
4
-
5
-
6
-
7
-
8
-
9
-
10
-
11
-
12
-
13
-
14
-
15
-
16
-
17
-
18
-
19
-
20
-
21
-
22
-
23
-
24
-
25
-
26
-
27
-
28
-
29
-
30
-
31
-
32
-
33
-
34
-
35
-
36
-
37
-
38
-
39
-
40
-
41
-
42
-
43
-
44
-
45
-
46
-
47
-
48
-
49
-
50
-
51
-
52
-
53
-
54
-
55
-
56
-
57
-
58
-
59
-
60
-
61
-
62
-
63
-
64
-
65
-
66
-
67
-
68
-
69
-
70
-
71
-
72
-
73
-
74
-
75
-
76
-
77
-
78
-
79
-
80
-
81
-
82
-
83
-
84
-
85
-
86
-
87
-
88
-
89
-
90
-
91
-
92
-
93
-
94
-
95
-
96
-
97
-
98
-
99
-
100
-
101
-
102
-
103
-
104
-
105
-
106
-
107
-
108
-
109
-
110
-
111
-
112
-
113
-
114
-
115
-
116
-
117
-
118
-
119
-
120
-
121
-
122
-
123
-
124
-
125
-
126
-
127
-
128
-
129
-
130
-
131
-
132
-
133
-
134
-
135
-
136
-
137
-
138
-
139
-
140
-
141
-
142
-
143
-
144
-
145
-
146
-
147
-
148
-
149
-
150
-
151
-
152
-
153
-
154
-
155
-
156
-
157
-
158
-
159
-
160
-
161
-
162
-
163
-
164
-
165
-
166
-
167
-
168
-
169
-
170
-
171
-
172
-
173
-
174
-
175
-
176
-
177
-
178
-
179
-
180
-
 181
181 -
 182
182 -
 183
183 -
 184
184 -
 185
185 -
 186
186 -
 187
187 -
 188
188 -
 189
189 -
 190
190 -
 191
191 -
 192
192 -
 193
193 -
 194
194 -
 195
195 -
 196
196 -
 197
197 -
 198
198 -
 199
199 -
 200
200 -
 201
201 -
202
-
203
-
204
-
205
-
206
-
207
-
208
-
209
-
210
-
211
-
212
-
213
-
214
-
215
-
216
-
217
-
218
-
219
-
220
-
221
-
222
-
223
-
224
-
225
-
226
-
227
-
228
-
229
-
230
-
231
-
232
-
233
-
234
-
235
-
236
-
237
-
238
-
239
-
240
-
241
-
242
-
243
-
244
-
245
-
246
-
247
-
248
-
249
-
250
-
251
-
252
-
253
-
254
-
255
-
256
-
257
-
258
-
259
-
260
-
261
-
262
-
263
-
264
-
265
-
266
-
267
-
268
-
269
-
270
-
271
-
272
-
273
-
274
-
275
-
276
-
277
-
278
-
279
-
280
-
281
-
282
-
283
-
284
-
285
-
286
-
287
-
288
-
289
-
290
-
291
-
292
 |
 |

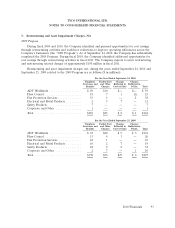
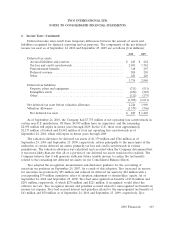
TYCO INTERNATIONAL LTD.
NOTES TO CONSOLIDATED FINANCIAL STATEMENTS
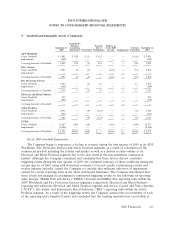
6. Income Taxes (Continued)
Deferred income taxes result from temporary differences between the amount of assets and
liabilities recognized for financial reporting and tax purposes. The components of the net deferred
income tax asset as of September 24, 2010 and September 25, 2009 are as follows ($ in millions):
2010 2009
Deferred tax assets:
Accrued liabilities and reserves .............................. $ 243 $ 262
Tax loss and credit carryforwards ............................. 2,491 1,742
Postretirement benefits .................................... 318 297
Deferred revenue ........................................ 200 250
Other ................................................. 483 429
3,735 2,980
Deferred tax liabilities:
Property, plant and equipment ............................... (711) (511)
Intangibles assets ........................................ (676) (325)
Other ................................................. (122) (175)
(1,509) (1,011)
Net deferred tax asset before valuation allowance ................... 2,226 1,969
Valuation allowance ........................................ (1,379) (766)
Net deferred tax asset ..................................... $ 847 $1,203
As of September 24, 2010, the Company had $7,735 million of net operating loss carryforwards in
certain non-U.S. jurisdictions. Of these, $4,785 million have no expiration, and the remaining
$2,950 million will expire in future years through 2029. In the U.S., there were approximately
$2,173 million of federal and $1,842 million of state net operating loss carryforwards as of
September 24, 2010, which will expire in future years through 2029.
The valuation allowance for deferred tax assets of $1,379 million and $766 million as of
September 24, 2010 and September 25, 2009, respectively, relates principally to the uncertainty of the
utilization of certain deferred tax assets, primarily tax loss and credit carryforwards in various
jurisdictions. The valuation allowance was calculated and recorded when the Company determined that
it was more-likely-than-not that all or a portion of our deferred tax assets would not be realized. The
Company believes that it will generate sufficient future taxable income to realize the tax benefits
related to the remaining net deferred tax assets on our Consolidated Balance Sheets.
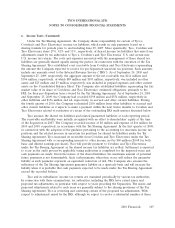
Tyco adopted the recognition, measurement and disclosure guidance for the accounting of
uncertain tax positions on September 29, 2007. As a result of this adoption, Tyco increased its reserve
for uncertain tax positions by $55 million and reduced its deferred tax assets by $24 million with a
corresponding $79 million cumulative effect of adoption adjustment to shareholders’ equity. As of
September 24, 2010 and September 25, 2009, Tyco had unrecognized tax benefits of $318 million and
$281 million, respectively, of which $276 million and $221 million, if recognized, would affect the
effective tax rate. Tyco recognizes interest and penalties accrued related to unrecognized tax benefits in
income tax expense. Tyco had accrued interest and penalties related to the unrecognized tax benefits of
$63 million and $50 million as of September 24, 2010 and September 25, 2009, respectively. Tyco
2010 Financials 103