The Hartford 2015 Annual Report Download - page 95
Download and view the complete annual report
Please find page 95 of the 2015 The Hartford annual report below. You can navigate through the pages in the report by either clicking on the pages listed below, or by using the keyword search tool below to find specific information within the annual report.-
 1
1 -
2
-
3
-
4
-
5
-
6
-
7
-
8
-
9
-
10
-
11
-
12
-
13
-
14
-
15
-
16
-
17
-
18
-
19
-
20
-
21
-
22
-
23
-
24
-
25
-
26
-
27
-
28
-
29
-
30
-
31
-
32
-
33
-
34
-
35
-
36
-
37
-
38
-
39
-
40
-
41
-
42
-
43
-
44
-
45
-
46
-
47
-
48
-
49
-
50
-
51
-
52
-
53
-
54
-
55
-
56
-
57
-
58
-
59
-
60
-
61
-
62
-
63
-
64
-
65
-
66
-
67
-
68
-
69
-
70
-
71
-
72
-
73
-
74
-
75
-
76
-
77
-
78
-
79
-
80
-
81
-
82
-
83
-
84
-
 85
85 -
 86
86 -
 87
87 -
 88
88 -
 89
89 -
 90
90 -
 91
91 -
 92
92 -
 93
93 -
 94
94 -
 95
95 -
 96
96 -
 97
97 -
 98
98 -
 99
99 -
 100
100 -
 101
101 -
 102
102 -
 103
103 -
 104
104 -
 105
105 -
106
-
107
-
108
-
109
-
110
-
111
-
112
-
113
-
114
-
115
-
116
-
117
-
118
-
119
-
120
-
121
-
122
-
123
-
124
-
125
-
126
-
127
-
128
-
129
-
130
-
131
-
132
-
133
-
134
-
135
-
136
-
137
-
138
-
139
-
140
-
141
-
142
-
143
-
144
-
145
-
146
-
147
-
148
-
149
-
150
-
151
-
152
-
153
-
154
-
155
-
156
-
157
-
158
-
159
-
160
-
161
-
162
-
163
-
164
-
165
-
166
-
167
-
168
-
169
-
170
-
171
-
172
-
173
-
174
-
175
-
176
-
177
-
178
-
179
-
180
-
181
-
182
-
183
-
184
-
185
-
186
-
187
-
188
-
189
-
190
-
191
-
192
-
193
-
194
-
195
-
196
-
197
-
198
-
199
-
200
-
201
-
202
-
203
-
204
-
205
-
206
-
207
-
208
-
209
-
210
-
211
-
212
-
213
-
214
-
215
-
216
-
217
-
218
-
219
-
220
-
221
-
222
-
223
-
224
-
225
-
226
-
227
-
228
-
229
-
230
-
231
-
232
-
233
-
234
-
235
-
236
-
237
-
238
-
239
-
240
-
241
-
242
-
243
-
244
-
245
-
246
-
247
-
248
-
249
-
250
-
251
-
252
-
253
-
254
-
255
 |
 |
95
Interest Rate Risk
Interest rate risk is the risk of financial loss due to adverse changes in the value of assets and liabilities arising from movements in
interest rates. Interest rate risk encompasses exposures with respect to changes in the level of interest rates, the shape of the term
structure of rates and the volatility of interest rates. Interest rate risk does not include exposure to changes in credit spreads. The
Company has exposure to interest rates arising from its fixed maturity securities, interest sensitive liabilities and discount rate
assumptions associated with the Company’s pension and other post retirement benefit obligations.
An increase in interest rates from current levels is generally a favorable development for the Company. Interest rate increases are
expected to provide additional net investment income, reduce the cost of the variable annuity hedging program, and limit the potential
risk of margin erosion due to minimum guaranteed crediting rates in certain Talcott Resolution products. However, if long-term interest
rates rise dramatically within a six to twelve month time period, certain Talcott Resolution businesses may be exposed to
disintermediation risk. Disintermediation risk refers to the risk that policyholders will surrender their contracts in a rising interest rate
environment requiring the Company to liquidate assets in an unrealized loss position. In conjunction with the interest rate risk
measurement and management techniques, certain of Talcott Resolution's fixed income product offerings have market value adjustment
provisions at contract surrender. An increase in interest rates may also impact the Company’s tax planning strategies and in particular its
ability to utilize tax benefits of previously recognized realized capital losses.
A decline in interest rates results in certain mortgage-backed and municipal securities being more susceptible to paydowns and
prepayments or calls. During such periods, the Company generally will not be able to reinvest the proceeds at comparable yields. Lower
interest rates will also likely result in lower net investment income, increased hedging costs associated with variable annuities and, if
declines are sustained for a long period of time, it may subject the Company to reinvestment risk and possibly reduced profit margins
associated with guaranteed crediting rates on certain Talcott Resolution products. Conversely, the fair value of the investment portfolio
will increase when interest rates decline and the Company’s interest expense will be lower on its variable rate debt obligations.
The Company manages its exposure to interest rate risk by constructing investment portfolios that maintain asset allocation limits and
asset/liability duration matching targets which may include the use of derivatives. The Company analyzes interest rate risk using various
models including parametric models and cash flow simulation under various market scenarios of the liabilities and their supporting
investment portfolios. Key metrics that the Company uses to quantify its exposure to interest rate risk inherent in its invested assets and
interest rate sensitive liabilities include duration, convexity and key rate duration. Duration is the price sensitivity of a financial
instrument or series of cash flows to a parallel change in the underlying yield curve used to value the financial instrument or series of
cash flows. For example, a duration of 5 means the price of the security will change by approximately 5% for a 100 basis point change
in interest rates. Convexity is used to approximate how the duration of a security changes as interest rates change in a parallel manner.
Key rate duration analysis measures the price sensitivity of a security or series of cash flows to each point along the yield curve and
enables the Company to estimate the price change of a security assuming non-parallel interest rate movements.
To calculate duration, convexity, and key rate durations, projections of asset and liability cash flows are discounted to a present value
using interest rate assumptions. These cash flows are then revalued at alternative interest rate levels to determine the percentage change
in fair value due to an incremental change in the entire yield curve for duration and convexity, or a particular point on the yield curve for
key rate duration. Cash flows from corporate obligations are assumed to be consistent with the contractual payment streams on a yield to
worst basis. Yield to worst is a basis that represents the lowest potential yield that can be received without the issuer actually defaulting.
The primary assumptions used in calculating cash flow projections include expected asset payment streams taking into account
prepayment speeds, issuer call options and contract holder behavior. Mortgage-backed and asset-backed securities are modeled based on
estimates of the rate of future prepayments of principal over the remaining life of the securities. These estimates are developed by
incorporating collateral surveillance and anticipated future market dynamics. Actual prepayment experience may vary from these
estimates.
The Company is also exposed to interest rate risk based upon the sensitivity of the present value of the Company’s pension and other
postretirement benefit obligations to changes in liability discount rates. The discount rate assumption is based upon an interest rate yield
curve that reflects high-quality fixed income investments consistent with the maturity profile of the expected liability cash flows. For
further discussion of discounting pension and other postretirement benefit obligations, refer to Note 16 - Employee Benefit Plans of
Notes to Consolidated Financial Statements. In addition, management evaluates performance of certain Talcott Resolution products
based on net investment spread which is, in part, influenced by changes in interest rates.
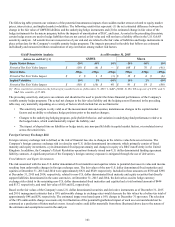
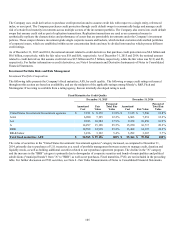
The investments and liabilities primarily associated with interest rate risk are included in the following discussion. Certain product
liabilities, including those containing GMWB or GMDB, expose the Company to interest rate risk but also have significant equity risk.
These liabilities are discussed as part of the Variable Product Guarantee Risks and Risk Management section.