The Hartford 2015 Annual Report Download - page 73
Download and view the complete annual report
Please find page 73 of the 2015 The Hartford annual report below. You can navigate through the pages in the report by either clicking on the pages listed below, or by using the keyword search tool below to find specific information within the annual report.-
 1
1 -
2
-
3
-
4
-
5
-
6
-
7
-
8
-
9
-
10
-
11
-
12
-
13
-
14
-
15
-
16
-
17
-
18
-
19
-
20
-
21
-
22
-
23
-
24
-
25
-
26
-
27
-
28
-
29
-
30
-
31
-
32
-
33
-
34
-
35
-
36
-
37
-
38
-
39
-
40
-
41
-
42
-
43
-
44
-
45
-
46
-
47
-
48
-
49
-
50
-
51
-
52
-
53
-
54
-
55
-
56
-
57
-
58
-
59
-
60
-
61
-
62
-
 63
63 -
 64
64 -
 65
65 -
 66
66 -
 67
67 -
 68
68 -
 69
69 -
 70
70 -
 71
71 -
 72
72 -
 73
73 -
 74
74 -
 75
75 -
 76
76 -
 77
77 -
 78
78 -
 79
79 -
 80
80 -
 81
81 -
 82
82 -
 83
83 -
84
-
85
-
86
-
87
-
88
-
89
-
90
-
91
-
92
-
93
-
94
-
95
-
96
-
97
-
98
-
99
-
100
-
101
-
102
-
103
-
104
-
105
-
106
-
107
-
108
-
109
-
110
-
111
-
112
-
113
-
114
-
115
-
116
-
117
-
118
-
119
-
120
-
121
-
122
-
123
-
124
-
125
-
126
-
127
-
128
-
129
-
130
-
131
-
132
-
133
-
134
-
135
-
136
-
137
-
138
-
139
-
140
-
141
-
142
-
143
-
144
-
145
-
146
-
147
-
148
-
149
-
150
-
151
-
152
-
153
-
154
-
155
-
156
-
157
-
158
-
159
-
160
-
161
-
162
-
163
-
164
-
165
-
166
-
167
-
168
-
169
-
170
-
171
-
172
-
173
-
174
-
175
-
176
-
177
-
178
-
179
-
180
-
181
-
182
-
183
-
184
-
185
-
186
-
187
-
188
-
189
-
190
-
191
-
192
-
193
-
194
-
195
-
196
-
197
-
198
-
199
-
200
-
201
-
202
-
203
-
204
-
205
-
206
-
207
-
208
-
209
-
210
-
211
-
212
-
213
-
214
-
215
-
216
-
217
-
218
-
219
-
220
-
221
-
222
-
223
-
224
-
225
-
226
-
227
-
228
-
229
-
230
-
231
-
232
-
233
-
234
-
235
-
236
-
237
-
238
-
239
-
240
-
241
-
242
-
243
-
244
-
245
-
246
-
247
-
248
-
249
-
250
-
251
-
252
-
253
-
254
-
255
 |
 |

73
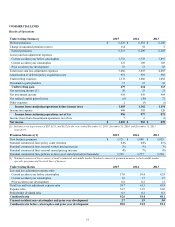
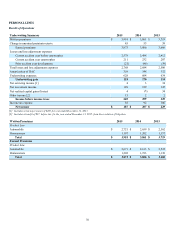
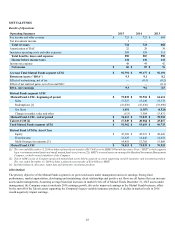
COMMERCIAL LINES
Results of Operations
Underwriting Summary 2015 2014 2013
Written premiums $ 6,625 $ 6,381 $ 6,208
Change in unearned premium reserve 114 92 5
Earned premiums 6,511 6,289 6,203
Losses and loss adjustment expenses
Current accident year before catastrophes 3,712 3,733 3,897
Current accident year catastrophes 121 109 105
Prior accident year development 53 13 83
Total losses and loss adjustment expenses 3,886 3,855 4,085
Amortization of deferred policy acquisition costs 951 919 905
Underwriting expenses 1,178 1,086 1,082
Dividends to policyholders 17 15 16
Underwriting gain 479 414 115
Net servicing income [1] 20 23 21
Net investment income 910 958 984
Net realized capital gains (losses) (6)(30) 72
Other expenses 2 (3) (1)
Income from continuing operations before income taxes 1,405 1,362 1,191
Income tax expense 409 385 320
Income from continuing operations, net of tax 996 977 871
Income (loss) from discontinued operations, net of tax 7 6 (1)
Net income $ 1,003 $ 983 $ 870
[1] Includes servicing revenues of $87, $113, and $112 for the years ended December 31, 2015, December 31, 2014, and December 31, 2013
respectively.
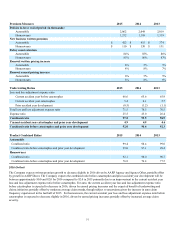
Premium Measures [1] 2015 2014 2013
New business premium $ 1,121 $ 1,088 $ 1,035
Standard commercial lines policy count retention 84% 84% 81%
Standard commercial lines renewal written pricing increase 2% 5% 7%
Standard commercial lines renewal earned pricing increase 4% 7% 8%
Standard commercial lines policies in-force as of end of period (in thousands) 1,325 1,277 1,250
[1] Standard commercial lines consists of small commercial and middle market. Standard commercial premium measures exclude middle market
specialty programs and livestock lines of business.
Underwriting Ratios 2015 2014 2013
Loss and loss adjustment expense ratio
Current accident year before catastrophes 57.0 59.4 62.8
Current accident year catastrophes 1.9 1.7 1.7
Prior accident year development 0.8 0.2 1.3
Total loss and loss adjustment expense ratio 59.7 61.3 65.9
Expense ratio 32.7 31.9 32.0
Policyholder dividend ratio 0.3 0.2 0.3
Combined ratio 92.6 93.4 98.1
Current accident year catastrophes and prior year development 2.7 1.9 3.0
Combined ratio before catastrophes and prior year development 90.0 91.5 95.1