The Hartford 2015 Annual Report Download - page 221
Download and view the complete annual report
Please find page 221 of the 2015 The Hartford annual report below. You can navigate through the pages in the report by either clicking on the pages listed below, or by using the keyword search tool below to find specific information within the annual report.-
 1
1 -
2
-
3
-
4
-
5
-
6
-
7
-
8
-
9
-
10
-
11
-
12
-
13
-
14
-
15
-
16
-
17
-
18
-
19
-
20
-
21
-
22
-
23
-
24
-
25
-
26
-
27
-
28
-
29
-
30
-
31
-
32
-
33
-
34
-
35
-
36
-
37
-
38
-
39
-
40
-
41
-
42
-
43
-
44
-
45
-
46
-
47
-
48
-
49
-
50
-
51
-
52
-
53
-
54
-
55
-
56
-
57
-
58
-
59
-
60
-
61
-
62
-
63
-
64
-
65
-
66
-
67
-
68
-
69
-
70
-
71
-
72
-
73
-
74
-
75
-
76
-
77
-
78
-
79
-
80
-
81
-
82
-
83
-
84
-
85
-
86
-
87
-
88
-
89
-
90
-
91
-
92
-
93
-
94
-
95
-
96
-
97
-
98
-
99
-
100
-
101
-
102
-
103
-
104
-
105
-
106
-
107
-
108
-
109
-
110
-
111
-
112
-
113
-
114
-
115
-
116
-
117
-
118
-
119
-
120
-
121
-
122
-
123
-
124
-
125
-
126
-
127
-
128
-
129
-
130
-
131
-
132
-
133
-
134
-
135
-
136
-
137
-
138
-
139
-
140
-
141
-
142
-
143
-
144
-
145
-
146
-
147
-
148
-
149
-
150
-
151
-
152
-
153
-
154
-
155
-
156
-
157
-
158
-
159
-
160
-
161
-
162
-
163
-
164
-
165
-
166
-
167
-
168
-
169
-
170
-
171
-
172
-
173
-
174
-
175
-
176
-
177
-
178
-
179
-
180
-
181
-
182
-
183
-
184
-
185
-
186
-
187
-
188
-
189
-
190
-
191
-
192
-
193
-
194
-
195
-
196
-
197
-
198
-
199
-
200
-
201
-
202
-
203
-
204
-
205
-
206
-
207
-
208
-
209
-
210
-
 211
211 -
 212
212 -
 213
213 -
 214
214 -
 215
215 -
 216
216 -
 217
217 -
 218
218 -
 219
219 -
 220
220 -
 221
221 -
 222
222 -
 223
223 -
 224
224 -
 225
225 -
 226
226 -
 227
227 -
 228
228 -
 229
229 -
 230
230 -
 231
231 -
232
-
233
-
234
-
235
-
236
-
237
-
238
-
239
-
240
-
241
-
242
-
243
-
244
-
245
-
246
-
247
-
248
-
249
-
250
-
251
-
252
-
253
-
254
-
255
 |
 |

Table of Contents THE HARTFORD FINANCIAL SERVICES GROUP, INC.
NOTES TO CONSOLIDATED FINANCIAL STATEMENTS (continued)
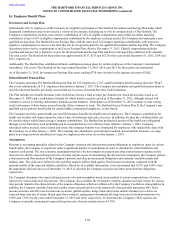
16. Employee Benefit Plans (continued)
F-90
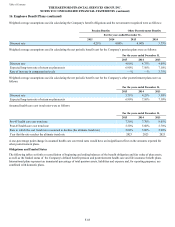
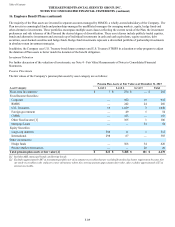
The fair values of the Company’s pension plan assets by asset category are as follows:
Pension Plan Assets at Fair Value as of December 31, 2014
Asset Category Level 1 Level 2 Level 3 Total
Short-term investments: $ 56 $ 252 $ — $ 308
Fixed Income Securities:
Corporate — 919 34 953
RMBS — 181 28 209
U.S. Treasuries 24 1,198 5 1,227
Foreign government — 65 5 70
CMBS — 156 — 156
Other fixed income [1] — 93 4 97
Equity Securities:
Large-cap domestic 526 — — 526
Mid-cap domestic — — — —
Small-cap domestic — — — —
International 435 3 — 438
Other investments:
Hedge funds — 562 181 743
Total pension plan assets at fair value [2] $ 1,041 $ 3,429 $ 257 $ 4,727
[1] Includes ABS and municipal bonds.
[2] Excludes approximately $42 of investment payables net of investment receivables that are excluded from this disclosure requirement because they
are trade receivables in the ordinary course of business where the carrying amount approximates fair value. Also excludes approximately $22 of
interest receivable.
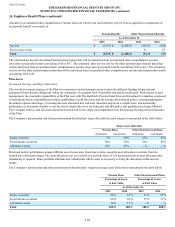
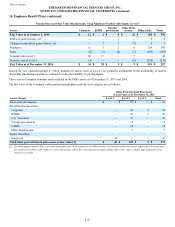
The tables below provide fair value level 3 rollforwards for the Pension Plan Assets for which significant unobservable inputs (Level 3)
are used in the fair value measurement on a recurring basis. The Plan classifies the fair value of financial instruments within Level 3 if there
are no observable markets for the instruments or, in the absence of active markets, if one or more of the significant inputs used to determine
fair value are based on the Plan’ s own assumptions. Therefore, the gains and losses in the tables below include changes in fair value due
to both observable and unobservable factors.
Pension Plan Asset Fair Value Measurements Using Significant Unobservable Inputs (Level 3)
Assets Corporate RMBS Foreign
government Mortgage
loans Other [1] Hedge
funds
Private
Market
Alternatives Totals
Fair Value as of January 1, 2015 $ 34 $ 28 $ 5 $ — $ 9 $ 181 $ — $ 257
Realized gains (losses), net — — — — — — — —
Changes in unrealized gains (losses), net (2) — (1) — (1) — 3 (1)
Purchases 12 14 1 54 3 2 17 103
Settlements — (14) — — (3) — — (17)
Sales (11) (2) — — (1)(24) — (38)
Transfers into Level 3 — 4 — — 1 — — 5
Transfers out of Level 3 (14) (6) — — (3)(105) — (128)
Fair Value as of December 31, 2015 $ 19 $ 24 $ 5 $ 54 $ 5 $ 54 $ 20 $ 181
[1] "Other" includes U.S. Treasuries, Other fixed income and Large-cap domestic equities investments.
During the year ended December 31, 2015, transfers into and (out) of Level 3 are primarily attributable to the appearance of or lack thereof
of market observable information and the re-evaluation of the observability of pricing inputs.