The Hartford 2015 Annual Report Download - page 188
Download and view the complete annual report
Please find page 188 of the 2015 The Hartford annual report below. You can navigate through the pages in the report by either clicking on the pages listed below, or by using the keyword search tool below to find specific information within the annual report.-
 1
1 -
2
-
3
-
4
-
5
-
6
-
7
-
8
-
9
-
10
-
11
-
12
-
13
-
14
-
15
-
16
-
17
-
18
-
19
-
20
-
21
-
22
-
23
-
24
-
25
-
26
-
27
-
28
-
29
-
30
-
31
-
32
-
33
-
34
-
35
-
36
-
37
-
38
-
39
-
40
-
41
-
42
-
43
-
44
-
45
-
46
-
47
-
48
-
49
-
50
-
51
-
52
-
53
-
54
-
55
-
56
-
57
-
58
-
59
-
60
-
61
-
62
-
63
-
64
-
65
-
66
-
67
-
68
-
69
-
70
-
71
-
72
-
73
-
74
-
75
-
76
-
77
-
78
-
79
-
80
-
81
-
82
-
83
-
84
-
85
-
86
-
87
-
88
-
89
-
90
-
91
-
92
-
93
-
94
-
95
-
96
-
97
-
98
-
99
-
100
-
101
-
102
-
103
-
104
-
105
-
106
-
107
-
108
-
109
-
110
-
111
-
112
-
113
-
114
-
115
-
116
-
117
-
118
-
119
-
120
-
121
-
122
-
123
-
124
-
125
-
126
-
127
-
128
-
129
-
130
-
131
-
132
-
133
-
134
-
135
-
136
-
137
-
138
-
139
-
140
-
141
-
142
-
143
-
144
-
145
-
146
-
147
-
148
-
149
-
150
-
151
-
152
-
153
-
154
-
155
-
156
-
157
-
158
-
159
-
160
-
161
-
162
-
163
-
164
-
165
-
166
-
167
-
168
-
169
-
170
-
171
-
172
-
173
-
174
-
175
-
176
-
177
-
 178
178 -
 179
179 -
 180
180 -
 181
181 -
 182
182 -
 183
183 -
 184
184 -
 185
185 -
 186
186 -
 187
187 -
 188
188 -
 189
189 -
 190
190 -
 191
191 -
 192
192 -
 193
193 -
 194
194 -
 195
195 -
 196
196 -
 197
197 -
 198
198 -
199
-
200
-
201
-
202
-
203
-
204
-
205
-
206
-
207
-
208
-
209
-
210
-
211
-
212
-
213
-
214
-
215
-
216
-
217
-
218
-
219
-
220
-
221
-
222
-
223
-
224
-
225
-
226
-
227
-
228
-
229
-
230
-
231
-
232
-
233
-
234
-
235
-
236
-
237
-
238
-
239
-
240
-
241
-
242
-
243
-
244
-
245
-
246
-
247
-
248
-
249
-
250
-
251
-
252
-
253
-
254
-
255
 |
 |

Table of Contents THE HARTFORD FINANCIAL SERVICES GROUP, INC.
NOTES TO CONSOLIDATED FINANCIAL STATEMENTS (continued)
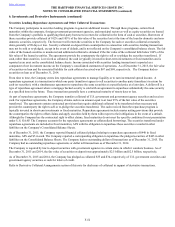
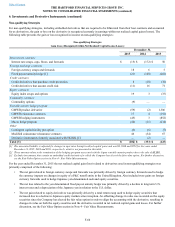
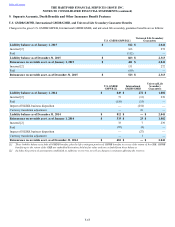
6. Investments and Derivative Instruments (continued)
F-57
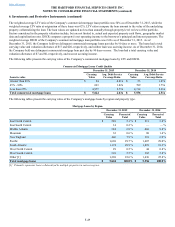
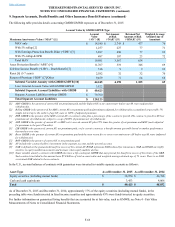
Change in Notional Amount
The net decrease in notional amount of derivatives since December 31, 2014 was primarily due to the following:
• The decline in notional amount related to the GMWB hedging instruments and the macro hedge program was primarily driven
by portfolio re-positioning, a decline in equity markets, and the expiration of certain options. The decline in the GMWB
product related notional amount was primarily driven by policyholder lapses and partial withdrawals.
• The decline in notional amount associated with interest rate derivatives was primarily driven by maturities of the derivatives.
• These declines were partially offset by an increase in notional amount related to credit derivatives that assume credit risk as a
means to earn credit spread while re-balancing within certain fixed maturity sectors.
• Additional increases in notional related to foreign currency swaps and forwards were primarily driven by the purchase of
foreign currency forwards to hedge Japanese yen-denominated cash and equity securities. In addition, the Company purchased
foreign currency forwards to hedge the currency impacts on changes in equity of a P&C runoff entity in the United Kingdom.
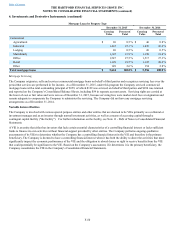
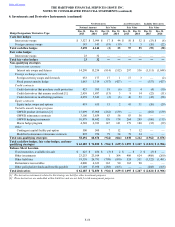
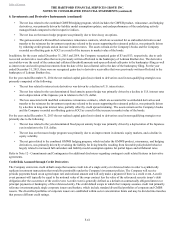
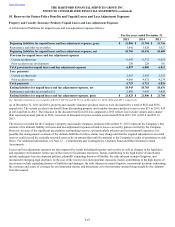
Change in Fair Value
The net improvement in the total fair value of derivative instruments since December 31, 2014 was primarily related to the following:
• The decrease in fair value of non-qualifying interest rate derivatives was primarily due to the termination of offsetting swaps
that were in a net gain position.
• The decrease in fair value related to the combined GMWB hedging program, which includes the GMWB product, reinsurance,
and hedging derivatives, was primarily driven by liability model assumption updates, and underperformance of the underlying
actively managed funds compared to their respective indices.
• The increase in fair value of fixed payout annuity hedges was primarily driven by the maturity of a currency swap, partially
offset by an increase in U.S. interest rates.
• The increase in the fair value associated with modified coinsurance reinsurance contracts, which are accounted for as embedded
derivatives and transfer to the reinsurer the investment experience related to the assets supporting the reinsured policies, was
primarily driven by widening credit spreads and an increase in interest rates.
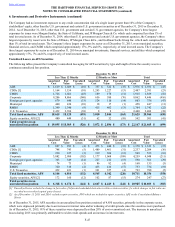
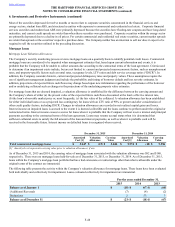
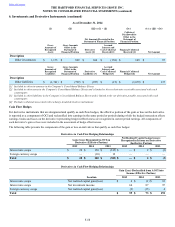
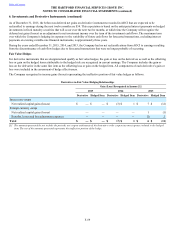
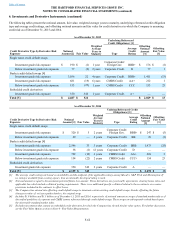
Offsetting of Derivative Assets/Liabilities
The following tables present the gross fair value amounts, the amounts offset, and net position of derivative instruments eligible for
offset in the Company's Consolidated Balance Sheets. Amounts offset include fair value amounts, income accruals and related cash
collateral receivables and payables associated with derivative instruments that are traded under a common master netting agreement, as
described in the preceding discussion. Also included in the tables are financial collateral receivables and payables, which are
contractually permitted to be offset upon an event of default, although are disallowed for offsetting under U.S. GAAP.
As of December 31, 2015
(i) (ii) (iii) = (i) - (ii) (iv) (v) = (iii) - (iv)
Net Amounts Presented in the
Statement of Financial Position
Collateral
Disallowed for
Offset in the
Statement of
Financial Position
Gross
Amounts of
Recognized
Assets
Gross Amounts
Offset in the
Statement of
Financial Position Derivative
Assets [1]
Accrued
Interest and
Cash Collateral
Received [2] Financial Collateral
Received [4] Net Amount
Description
Other investments $ 933 $ 756 $ 1 $ 176 $ 100 $ 77
Gross
Amounts of
Recognized
Liabilities
Gross Amounts
Offset in the
Statement of
Financial Position Derivative
Liabilities [3]
Accrued
Interest and
Cash Collateral
Pledged [3] Financial Collateral
Pledged [4] Net Amount
Description
Other liabilities $ (1,730) $ (818) $ (798) $ (114) $ (889) $ (23)