The Hartford 2015 Annual Report Download - page 107
Download and view the complete annual report
Please find page 107 of the 2015 The Hartford annual report below. You can navigate through the pages in the report by either clicking on the pages listed below, or by using the keyword search tool below to find specific information within the annual report.-
 1
1 -
2
-
3
-
4
-
5
-
6
-
7
-
8
-
9
-
10
-
11
-
12
-
13
-
14
-
15
-
16
-
17
-
18
-
19
-
20
-
21
-
22
-
23
-
24
-
25
-
26
-
27
-
28
-
29
-
30
-
31
-
32
-
33
-
34
-
35
-
36
-
37
-
38
-
39
-
40
-
41
-
42
-
43
-
44
-
45
-
46
-
47
-
48
-
49
-
50
-
51
-
52
-
53
-
54
-
55
-
56
-
57
-
58
-
59
-
60
-
61
-
62
-
63
-
64
-
65
-
66
-
67
-
68
-
69
-
70
-
71
-
72
-
73
-
74
-
75
-
76
-
77
-
78
-
79
-
80
-
81
-
82
-
83
-
84
-
85
-
86
-
87
-
88
-
89
-
90
-
91
-
92
-
93
-
94
-
95
-
96
-
 97
97 -
 98
98 -
 99
99 -
 100
100 -
 101
101 -
 102
102 -
 103
103 -
 104
104 -
 105
105 -
 106
106 -
 107
107 -
 108
108 -
 109
109 -
 110
110 -
 111
111 -
 112
112 -
 113
113 -
 114
114 -
 115
115 -
 116
116 -
 117
117 -
118
-
119
-
120
-
121
-
122
-
123
-
124
-
125
-
126
-
127
-
128
-
129
-
130
-
131
-
132
-
133
-
134
-
135
-
136
-
137
-
138
-
139
-
140
-
141
-
142
-
143
-
144
-
145
-
146
-
147
-
148
-
149
-
150
-
151
-
152
-
153
-
154
-
155
-
156
-
157
-
158
-
159
-
160
-
161
-
162
-
163
-
164
-
165
-
166
-
167
-
168
-
169
-
170
-
171
-
172
-
173
-
174
-
175
-
176
-
177
-
178
-
179
-
180
-
181
-
182
-
183
-
184
-
185
-
186
-
187
-
188
-
189
-
190
-
191
-
192
-
193
-
194
-
195
-
196
-
197
-
198
-
199
-
200
-
201
-
202
-
203
-
204
-
205
-
206
-
207
-
208
-
209
-
210
-
211
-
212
-
213
-
214
-
215
-
216
-
217
-
218
-
219
-
220
-
221
-
222
-
223
-
224
-
225
-
226
-
227
-
228
-
229
-
230
-
231
-
232
-
233
-
234
-
235
-
236
-
237
-
238
-
239
-
240
-
241
-
242
-
243
-
244
-
245
-
246
-
247
-
248
-
249
-
250
-
251
-
252
-
253
-
254
-
255
 |
 |

107
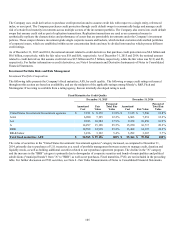
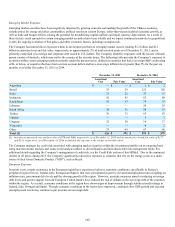
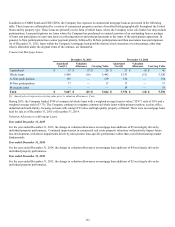
The fair value of AFS securities was relatively consistent with December 31, 2014, as the impact of widening credit spreads and an
increase in interest rates was partially offset by the reinvestment of short-term assets into fixed maturities, as well as the purchase of U.S.
Treasuries with the proceeds received from repurchase agreements. The Company has reduced its allocation to tax-exempt municipal
bonds in favor of other investments that provide greater after-tax economic return potential given current market conditions and the
Company’s tax position. During 2015, the Company increased its investment in the financial services sector through purchases of
primarily investment grade corporate securities while reducing it's exposure to the energy sector as a result of the continued volatility in
oil prices. These changes are discussed further below.
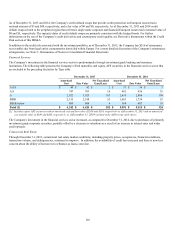
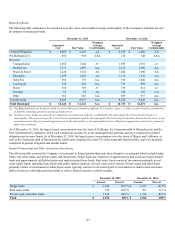
Energy Exposure
Market values of securities in the energy sector continued to experience volatility throughout 2015. The continued price volatility has
caused credit spreads to widen for corporate and sovereign issuers that generate a large portion of their revenues from energy. The
impact is more pronounced on issuers with below investment grade credit. Ultimately, the impact on these issuers will be determined by
the severity and duration of the decline in prices and the ability of the issuers to hedge price declines, adjust their cost structure or find
other sources of revenue.
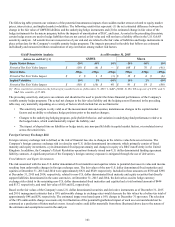
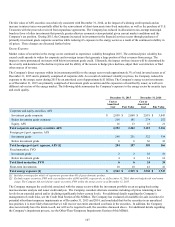
The Company's direct exposure within its investment portfolio to the energy sector totals approximately 3% of total invested assets as of
December 31, 2015 and is primarily comprised of corporate debt. As a result of continued volatility in prices, the Company reduced its
exposure to the energy sector during 2015 by an amortized cost of approximately $1 billion. The Company's energy sector investments
as of December 31, 2015 are primarily comprised of investment grade securities and the exposure is diversified by issuer, as well as in
different sub-sectors of the energy market. The following table summarizes the Company's exposure to the energy sector by security type
and credit quality.
December 31, 2015 December 31, 2014
Cost or
Amortized
Cost Fair Value
Cost or
Amortized
Cost Fair Value
Corporate and equity securities, AFS
Investment grade corporate $ 2,058 $ 2,068 $ 2,818 $ 3,043
Below investment grade corporate 218 181 274 252
Equity, AFS 16 13 23 21
Total corporate and equity securities, AFS 2,292 2,262 3,115 3,316
Foreign govt./govt. agencies, AFS
Investment grade 248 251 322 334
Below investment grade 6 6 36 32
Total foreign govt./govt. agencies, AFS [1] 254 257 358 366
Fixed maturities, FVO
Investment grade 2 2 10 10
Below investment grade 4 4 14 14
Total fixed maturities, FVO 6 6 24 24
Short-term investments 10 10 41 41
Total energy exposure [2] $ 2,562 $ 2,535 $ 3,538 $ 3,747
[1] Includes sovereigns for which oil exports are greater than 4% of gross domestic product.
[2] Excludes equity securities, FVO with cost and fair value of $45 and $45, respectively, as of December 31, 2014, that are hedged with total return
swaps. The Company did not hold any equity securities, FVO within the energy sector as of December 31, 2015.
The Company manages the credit risk associated with the energy sector within the investment portfolio on an on-going basis using
macroeconomic analysis and issuer credit analysis. The Company considers alternate scenarios including oil prices remaining at low
levels for an extended period and/or declining significantly below current levels. For additional details regarding the Company’s
management of credit risks, see the Credit Risk Section of this MD&A. The Company has evaluated all available-for-sale securities for
potential other-than-temporary impairments as of December 31, 2015 and 2014, and concluded that for the securities in an unrealized
loss position, it is more likely than not that we will recover our entire amortized cost basis in the securities. In addition, the Company
does not currently have the intent-to-sell, nor will we be required to sell, the securities discussed above. For additional details regarding
the Company’s impairment process, see the Other-Than-Temporary Impairments Section of this MD&A.