The Hartford 2015 Annual Report Download - page 187
Download and view the complete annual report
Please find page 187 of the 2015 The Hartford annual report below. You can navigate through the pages in the report by either clicking on the pages listed below, or by using the keyword search tool below to find specific information within the annual report.-
 1
1 -
2
-
3
-
4
-
5
-
6
-
7
-
8
-
9
-
10
-
11
-
12
-
13
-
14
-
15
-
16
-
17
-
18
-
19
-
20
-
21
-
22
-
23
-
24
-
25
-
26
-
27
-
28
-
29
-
30
-
31
-
32
-
33
-
34
-
35
-
36
-
37
-
38
-
39
-
40
-
41
-
42
-
43
-
44
-
45
-
46
-
47
-
48
-
49
-
50
-
51
-
52
-
53
-
54
-
55
-
56
-
57
-
58
-
59
-
60
-
61
-
62
-
63
-
64
-
65
-
66
-
67
-
68
-
69
-
70
-
71
-
72
-
73
-
74
-
75
-
76
-
77
-
78
-
79
-
80
-
81
-
82
-
83
-
84
-
85
-
86
-
87
-
88
-
89
-
90
-
91
-
92
-
93
-
94
-
95
-
96
-
97
-
98
-
99
-
100
-
101
-
102
-
103
-
104
-
105
-
106
-
107
-
108
-
109
-
110
-
111
-
112
-
113
-
114
-
115
-
116
-
117
-
118
-
119
-
120
-
121
-
122
-
123
-
124
-
125
-
126
-
127
-
128
-
129
-
130
-
131
-
132
-
133
-
134
-
135
-
136
-
137
-
138
-
139
-
140
-
141
-
142
-
143
-
144
-
145
-
146
-
147
-
148
-
149
-
150
-
151
-
152
-
153
-
154
-
155
-
156
-
157
-
158
-
159
-
160
-
161
-
162
-
163
-
164
-
165
-
166
-
167
-
168
-
169
-
170
-
171
-
172
-
173
-
174
-
175
-
176
-
 177
177 -
 178
178 -
 179
179 -
 180
180 -
 181
181 -
 182
182 -
 183
183 -
 184
184 -
 185
185 -
 186
186 -
 187
187 -
 188
188 -
 189
189 -
 190
190 -
 191
191 -
 192
192 -
 193
193 -
 194
194 -
 195
195 -
 196
196 -
 197
197 -
198
-
199
-
200
-
201
-
202
-
203
-
204
-
205
-
206
-
207
-
208
-
209
-
210
-
211
-
212
-
213
-
214
-
215
-
216
-
217
-
218
-
219
-
220
-
221
-
222
-
223
-
224
-
225
-
226
-
227
-
228
-
229
-
230
-
231
-
232
-
233
-
234
-
235
-
236
-
237
-
238
-
239
-
240
-
241
-
242
-
243
-
244
-
245
-
246
-
247
-
248
-
249
-
250
-
251
-
252
-
253
-
254
-
255
 |
 |

Table of Contents THE HARTFORD FINANCIAL SERVICES GROUP, INC.
NOTES TO CONSOLIDATED FINANCIAL STATEMENTS (continued)
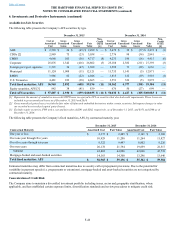
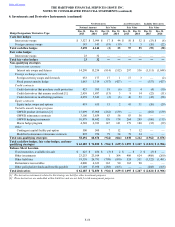
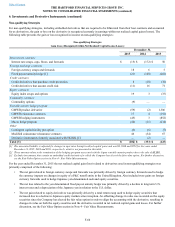
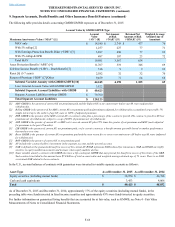
6. Investments and Derivative Instruments (continued)
F-56
Net Derivatives Asset Derivatives Liability Derivatives
Notional Amount Fair Value Fair Value Fair Value
Hedge Designation/ Derivative Type Dec 31,
2015 Dec 31,
2014 Dec 31,
2015 Dec 31,
2014 Dec 31,
2015 Dec 31,
2014 Dec 31,
2015 Dec 31,
2014
Cash flow hedges
Interest rate swaps $ 3,527 $ 3,999 $ 17 $ 44 $ 50 $ 52 $ (33) $ (8)
Foreign currency swaps 143 143 (19)(19) 7 3 (26) (22)
Total cash flow hedges 3,670 4,142 (2) 25 57 55 (59) (30)
Fair value hedges
Interest rate swaps 23 32 — — — — — —
Total fair value hedges 23 32 — — — — — —
Non-qualifying strategies
Interest rate contracts
Interest rate swaps and futures 14,290 15,254 (814)(512) 297 536 (1,111) (1,048)
Foreign exchange contracts
Foreign currency swaps and forwards 653 177 17 1 17 3 — (2)
Fixed payout annuity hedge 1,063 1,319 (357)(427) — — (357) (427)
Credit contracts
Credit derivatives that purchase credit protection 423 595 18 (6) 22 4 (4) (10)
Credit derivatives that assume credit risk [1] 2,458 1,487 (13) 3 9 14 (22) (11)
Credit derivatives in offsetting positions 4,059 5,343 (2)(3) 40 53 (42) (56)
Equity contracts
Equity index swaps and options 419 635 15 2 41 31 (26) (29)
Variable annuity hedge program
GMWB product derivatives [2] 15,099 17,908 (262)(139) — — (262) (139)
GMWB reinsurance contracts 3,106 3,659 83 56 83 56 — —
GMWB hedging instruments 10,979 14,442 158 174 264 289 (106) (115)
Macro hedge program 4,548 6,383 147 141 179 180 (32) (39)
Other
Contingent capital facility put option 500 500 7 12 7 12 — —
Modified coinsurance reinsurance contracts 895 974 79 34 79 34 — —
Total non-qualifying strategies 58,492 68,676 (924)(664) 1,038 1,212 (1,962) (1,876)
Total cash flow hedges, fair value hedges, and non-
qualifying strategies $ 62,185 $ 72,850 $ (926) $ (639) $ 1,095 $ 1,267 $ (2,021) $ (1,906)
Balance Sheet Location
Fixed maturities, available-for-sale $ 425 $ 454 $ (3) $ 2 $ — $ 2 $ (3) $ —
Other investments 23,253 23,014 1 364 409 624 (408) (260)
Other liabilities 19,358 26,791 (798)(930) 524 551 (1,322) (1,481)
Reinsurance recoverables 4,000 4,633 162 90 162 90 — —
Other policyholder funds and benefits payable 15,149 17,958 (288)(165) — — (288) (165)
Total derivatives $ 62,185 $ 72,850 $ (926) $ (639) $ 1,095 $ 1,267 $ (2,021) $ (1,906)
[1] The derivative instruments related to this strategy are held for other investment purposes.
[2] These derivatives are embedded within liabilities and are not held for risk management purposes.