The Hartford 2015 Annual Report Download - page 138
Download and view the complete annual report
Please find page 138 of the 2015 The Hartford annual report below. You can navigate through the pages in the report by either clicking on the pages listed below, or by using the keyword search tool below to find specific information within the annual report.-
 1
1 -
2
-
3
-
4
-
5
-
6
-
7
-
8
-
9
-
10
-
11
-
12
-
13
-
14
-
15
-
16
-
17
-
18
-
19
-
20
-
21
-
22
-
23
-
24
-
25
-
26
-
27
-
28
-
29
-
30
-
31
-
32
-
33
-
34
-
35
-
36
-
37
-
38
-
39
-
40
-
41
-
42
-
43
-
44
-
45
-
46
-
47
-
48
-
49
-
50
-
51
-
52
-
53
-
54
-
55
-
56
-
57
-
58
-
59
-
60
-
61
-
62
-
63
-
64
-
65
-
66
-
67
-
68
-
69
-
70
-
71
-
72
-
73
-
74
-
75
-
76
-
77
-
78
-
79
-
80
-
81
-
82
-
83
-
84
-
85
-
86
-
87
-
88
-
89
-
90
-
91
-
92
-
93
-
94
-
95
-
96
-
97
-
98
-
99
-
100
-
101
-
102
-
103
-
104
-
105
-
106
-
107
-
108
-
109
-
110
-
111
-
112
-
113
-
114
-
115
-
116
-
117
-
118
-
119
-
120
-
121
-
122
-
123
-
124
-
125
-
126
-
127
-
 128
128 -
 129
129 -
 130
130 -
 131
131 -
 132
132 -
 133
133 -
 134
134 -
 135
135 -
 136
136 -
 137
137 -
 138
138 -
 139
139 -
 140
140 -
 141
141 -
 142
142 -
 143
143 -
 144
144 -
 145
145 -
 146
146 -
 147
147 -
 148
148 -
149
-
150
-
151
-
152
-
153
-
154
-
155
-
156
-
157
-
158
-
159
-
160
-
161
-
162
-
163
-
164
-
165
-
166
-
167
-
168
-
169
-
170
-
171
-
172
-
173
-
174
-
175
-
176
-
177
-
178
-
179
-
180
-
181
-
182
-
183
-
184
-
185
-
186
-
187
-
188
-
189
-
190
-
191
-
192
-
193
-
194
-
195
-
196
-
197
-
198
-
199
-
200
-
201
-
202
-
203
-
204
-
205
-
206
-
207
-
208
-
209
-
210
-
211
-
212
-
213
-
214
-
215
-
216
-
217
-
218
-
219
-
220
-
221
-
222
-
223
-
224
-
225
-
226
-
227
-
228
-
229
-
230
-
231
-
232
-
233
-
234
-
235
-
236
-
237
-
238
-
239
-
240
-
241
-
242
-
243
-
244
-
245
-
246
-
247
-
248
-
249
-
250
-
251
-
252
-
253
-
254
-
255
 |
 |

Table of Contents
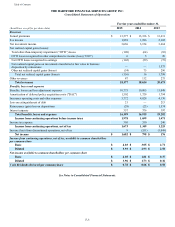
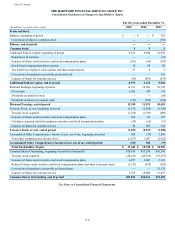
THE HARTFORD FINANCIAL SERVICES GROUP, INC.
Consolidated Statements of Cash Flows
F-7
For the years ended December 31,
(In millions) 2015 2014 2013
Operating Activities
Net income $ 1,682 $ 798 $ 176
Adjustments to reconcile net income to net cash provided by operating activities
Amortization of deferred policy acquisition costs 1,502 1,729 2,701
Additions to deferred policy acquisition costs (1,390) (1,364) (1,330)
Net realized capital (gains) losses 156 141 (1,149)
Depreciation and amortization 373 276 189
(Gain) loss on sale of business (6) 653 102
Loss on extinguishment of debt 21 — 213
Reinsurance (gain) loss on disposition (28) (23) 1,574
Other operating activities, net 153 203 69
Change in assets and liabilities:
Increase (decrease) in reserve for future policy benefits and unpaid loss and loss adjustment expenses and unearned
premiums 305 226 (308)
Decrease (increase) in reinsurance recoverables 146 (22) (561)
Decrease (increase) in receivables and other assets 183 (122) (409)
(Decrease) increase in payables and accruals (704) (937) 497
Increase (decrease) in accrued and deferred income taxes 363 328 (526)
Net disbursements from investment contracts related to policyholder funds — international variable annuities — (3,993) (9,189)
Net decrease in equity securities, trading — 3,993 9,188
Net cash provided by operating activities 2,756 1,886 1,237
Investing Activities
Proceeds from the sale/maturity/prepayment of:
Fixed maturities, available-for-sale 25,946 25,309 40,266
Fixed maturities, fair value option 181 401 322
Equity securities, available-for-sale 1,319 354 274
Mortgage loans 792 646 468
Partnerships 624 490 368
Payments for the purchase of:
Fixed maturities, available-for-sale (27,744) (22,545) (35,446)
Fixed maturities, fair value option (251) (369) (150)
Equity securities, available-for-sale (1,454) (683) (212)
Mortgage loans (870) (604) (718)
Partnerships (620) (312) (353)
Proceeds from business sold — 963 815
Net proceeds from (payments for) derivatives (173) 10 (2,208)
Net decrease in policy loans (30) (11) (5)
Net additions to property and equipment (307) (121) (64)
Net proceeds from (payments for) short-term investments 3,071 (1,814) 318
Other investing activities, net 1 (18) 70
Net cash provided by investing activities 485 1,696 3,745
Financing Activities
Deposits and other additions to investment and universal life-type contracts 4,718 5,289 5,942
Withdrawals and other deductions from investment and universal life-type contracts (17,085) (21,870) (25,034)
Net transfers from separate accounts related to investment and universal life-type contracts 11,046 14,366 16,978
Repayments at maturity or settlement of consumer notes (33) (13) (77)
Net increase (decrease) in securities loaned or sold under agreements to repurchase 507 — (1,988)
Repurchase of warrants — — (33)
Repayment of debt (773) (200) (1,338)
Proceeds from the issuance of debt — — 533
Proceeds from net issuance of shares under incentive and stock compensation plans, excess tax benefit and other 42 30 20
Treasury stock acquired (1,250) (1,796) (600)
Dividends paid on preferred stock — — (21)
Dividends paid on common stock (316) (282) (202)
Net cash used for financing activities (3,144) (4,476) (5,820)
Foreign exchange rate effect on cash (48) (135) (155)
Net increase (decrease) in cash 49 (1,029) (993)
Cash — beginning of period 399 1,428 2,421
Cash — end of period $ 448 $ 399 $ 1,428
Supplemental Disclosure of Cash Flow Information
Income tax refunds received (payments) $ 80 $ 313 $ (69)
Interest paid $ 361 $ 377 $ 402
See Notes to Consolidated Financial Statements.