The Hartford 2015 Annual Report Download - page 175
Download and view the complete annual report
Please find page 175 of the 2015 The Hartford annual report below. You can navigate through the pages in the report by either clicking on the pages listed below, or by using the keyword search tool below to find specific information within the annual report.-
 1
1 -
2
-
3
-
4
-
5
-
6
-
7
-
8
-
9
-
10
-
11
-
12
-
13
-
14
-
15
-
16
-
17
-
18
-
19
-
20
-
21
-
22
-
23
-
24
-
25
-
26
-
27
-
28
-
29
-
30
-
31
-
32
-
33
-
34
-
35
-
36
-
37
-
38
-
39
-
40
-
41
-
42
-
43
-
44
-
45
-
46
-
47
-
48
-
49
-
50
-
51
-
52
-
53
-
54
-
55
-
56
-
57
-
58
-
59
-
60
-
61
-
62
-
63
-
64
-
65
-
66
-
67
-
68
-
69
-
70
-
71
-
72
-
73
-
74
-
75
-
76
-
77
-
78
-
79
-
80
-
81
-
82
-
83
-
84
-
85
-
86
-
87
-
88
-
89
-
90
-
91
-
92
-
93
-
94
-
95
-
96
-
97
-
98
-
99
-
100
-
101
-
102
-
103
-
104
-
105
-
106
-
107
-
108
-
109
-
110
-
111
-
112
-
113
-
114
-
115
-
116
-
117
-
118
-
119
-
120
-
121
-
122
-
123
-
124
-
125
-
126
-
127
-
128
-
129
-
130
-
131
-
132
-
133
-
134
-
135
-
136
-
137
-
138
-
139
-
140
-
141
-
142
-
143
-
144
-
145
-
146
-
147
-
148
-
149
-
150
-
151
-
152
-
153
-
154
-
155
-
156
-
157
-
158
-
159
-
160
-
161
-
162
-
163
-
164
-
 165
165 -
 166
166 -
 167
167 -
 168
168 -
 169
169 -
 170
170 -
 171
171 -
 172
172 -
 173
173 -
 174
174 -
 175
175 -
 176
176 -
 177
177 -
 178
178 -
 179
179 -
 180
180 -
 181
181 -
 182
182 -
 183
183 -
 184
184 -
 185
185 -
186
-
187
-
188
-
189
-
190
-
191
-
192
-
193
-
194
-
195
-
196
-
197
-
198
-
199
-
200
-
201
-
202
-
203
-
204
-
205
-
206
-
207
-
208
-
209
-
210
-
211
-
212
-
213
-
214
-
215
-
216
-
217
-
218
-
219
-
220
-
221
-
222
-
223
-
224
-
225
-
226
-
227
-
228
-
229
-
230
-
231
-
232
-
233
-
234
-
235
-
236
-
237
-
238
-
239
-
240
-
241
-
242
-
243
-
244
-
245
-
246
-
247
-
248
-
249
-
250
-
251
-
252
-
253
-
254
-
255
 |
 |

Table of Contents THE HARTFORD FINANCIAL SERVICES GROUP, INC.
NOTES TO CONSOLIDATED FINANCIAL STATEMENTS (continued)
6. Investments and Derivative Instruments (continued)
F-44
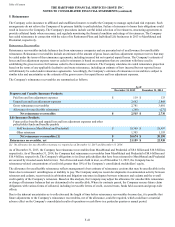
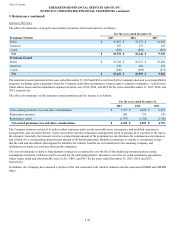
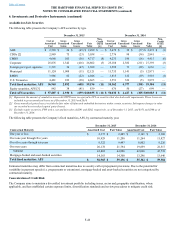
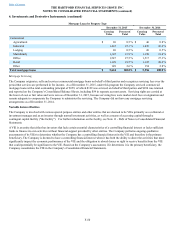
Sales of Available-for-Sale Securities
For the years ended December 31,
2015 2014 2013
Fixed maturities, AFS
Sale proceeds $ 20,615 $ 22,923 $ 39,225
Gross gains [1] 372 456 2,143
Gross losses (317)(182) (654)
Equity securities, AFS
Sale proceeds $ 1,319 $ 354 $ 274
Gross gains 61 22 96
Gross losses (46)(20) (20)
[1] Includes $1.5 billion of gross gains related to the sale of the Individual Life and Retirement Plans businesses for the year ended December 31,
2013.
Sales of AFS securities in 2015 were primarily a result of duration and liquidity management, as well as tactical changes to the portfolio
as a result of changing market conditions.
Recognition and Presentation of Other-Than-Temporary Impairments
The Company deems bonds and certain equity securities with debt-like characteristics (collectively “debt securities”) to be other-than-
temporarily impaired (“impaired”) if a security meets the following conditions: a) the Company intends to sell or it is more likely than
not that the Company will be required to sell the security before a recovery in value, or b) the Company does not expect to recover the
entire amortized cost basis of the security. If the Company intends to sell or it is more likely than not that the Company will be required
to sell the security before a recovery in value, a charge is recorded in net realized capital losses equal to the difference between the fair
value and amortized cost basis of the security. For those impaired debt securities which do not meet the first condition and for which the
Company does not expect to recover the entire amortized cost basis, the difference between the security’s amortized cost basis and the
fair value is separated into the portion representing a credit OTTI, which is recorded in net realized capital losses, and the remaining
non-credit impairment, which is recorded in OCI. Generally, the Company determines a security’s credit impairment as the difference
between its amortized cost basis and its best estimate of expected future cash flows discounted at the security’s effective yield prior to
impairment. The remaining non-credit impairment is the difference between the security’s fair value and the Company’s best estimate of
expected future cash flows discounted at the security’s effective yield prior to the impairment, which typically includes current market
liquidity and risk premiums. The previous amortized cost basis less the impairment recognized in net realized capital losses becomes the
security’s new cost basis. The Company accretes the new cost basis to the estimated future cash flows over the expected remaining life
of the security by prospectively adjusting the security’s yield, if necessary.
The Company’s evaluation of whether a credit impairment exists for debt securities includes but is not limited to, the following factors:
(a) changes in the financial condition of the security’s underlying collateral, (b) whether the issuer is current on contractually obligated
interest and principal payments, (c) changes in the financial condition, credit rating and near-term prospects of the issuer, (d) the extent
to which the fair value has been less than the amortized cost of the security and (e) the payment structure of the security. The Company’s
best estimate of expected future cash flows used to determine the credit loss amount is a quantitative and qualitative process that
incorporates information received from third-party sources along with certain internal assumptions and judgments regarding the future
performance of the security. The Company’s best estimate of future cash flows involves assumptions including, but not limited to,
various performance indicators, such as historical and projected default and recovery rates, credit ratings, current and projected
delinquency rates, and loan-to-value ("LTV") ratios. In addition, for structured securities, the Company considers factors including, but
not limited to, average cumulative collateral loss rates that vary by vintage year, commercial and residential property value declines that
vary by property type and location and commercial real estate delinquency levels. These assumptions require the use of significant
management judgment and include the probability of issuer default and estimates regarding timing and amount of expected recoveries
which may include estimating the underlying collateral value. In addition, projections of expected future debt security cash flows may
change based upon new information regarding the performance of the issuer and/or underlying collateral such as changes in the
projections of the underlying property value estimates.