The Hartford 2015 Annual Report Download - page 82
Download and view the complete annual report
Please find page 82 of the 2015 The Hartford annual report below. You can navigate through the pages in the report by either clicking on the pages listed below, or by using the keyword search tool below to find specific information within the annual report.-
 1
1 -
2
-
3
-
4
-
5
-
6
-
7
-
8
-
9
-
10
-
11
-
12
-
13
-
14
-
15
-
16
-
17
-
18
-
19
-
20
-
21
-
22
-
23
-
24
-
25
-
26
-
27
-
28
-
29
-
30
-
31
-
32
-
33
-
34
-
35
-
36
-
37
-
38
-
39
-
40
-
41
-
42
-
43
-
44
-
45
-
46
-
47
-
48
-
49
-
50
-
51
-
52
-
53
-
54
-
55
-
56
-
57
-
58
-
59
-
60
-
61
-
62
-
63
-
64
-
65
-
66
-
67
-
68
-
69
-
70
-
71
-
 72
72 -
 73
73 -
 74
74 -
 75
75 -
 76
76 -
 77
77 -
 78
78 -
 79
79 -
 80
80 -
 81
81 -
 82
82 -
 83
83 -
 84
84 -
 85
85 -
 86
86 -
 87
87 -
 88
88 -
 89
89 -
 90
90 -
 91
91 -
 92
92 -
93
-
94
-
95
-
96
-
97
-
98
-
99
-
100
-
101
-
102
-
103
-
104
-
105
-
106
-
107
-
108
-
109
-
110
-
111
-
112
-
113
-
114
-
115
-
116
-
117
-
118
-
119
-
120
-
121
-
122
-
123
-
124
-
125
-
126
-
127
-
128
-
129
-
130
-
131
-
132
-
133
-
134
-
135
-
136
-
137
-
138
-
139
-
140
-
141
-
142
-
143
-
144
-
145
-
146
-
147
-
148
-
149
-
150
-
151
-
152
-
153
-
154
-
155
-
156
-
157
-
158
-
159
-
160
-
161
-
162
-
163
-
164
-
165
-
166
-
167
-
168
-
169
-
170
-
171
-
172
-
173
-
174
-
175
-
176
-
177
-
178
-
179
-
180
-
181
-
182
-
183
-
184
-
185
-
186
-
187
-
188
-
189
-
190
-
191
-
192
-
193
-
194
-
195
-
196
-
197
-
198
-
199
-
200
-
201
-
202
-
203
-
204
-
205
-
206
-
207
-
208
-
209
-
210
-
211
-
212
-
213
-
214
-
215
-
216
-
217
-
218
-
219
-
220
-
221
-
222
-
223
-
224
-
225
-
226
-
227
-
228
-
229
-
230
-
231
-
232
-
233
-
234
-
235
-
236
-
237
-
238
-
239
-
240
-
241
-
242
-
243
-
244
-
245
-
246
-
247
-
248
-
249
-
250
-
251
-
252
-
253
-
254
-
255
 |
 |
82
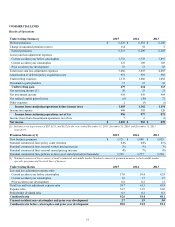
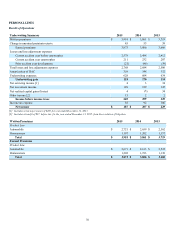
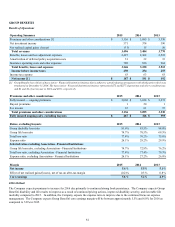
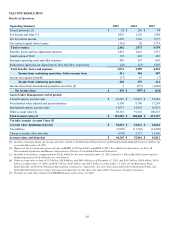
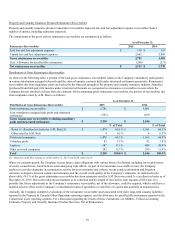
Year ended December 31, 2015 compared to the year ended December 31, 2014
Net income decreased in 2015, as compared to the prior year period, primarily due to higher benefits, losses and loss adjustment
expenses, higher net realized capital losses and lower net investment income partially offset by higher premiums and other
considerations and lower insurance operating costs and other expenses.
Premiums and other considerations increased in 2015, as compared to the prior year period, due primarily to increased sales and
improved persistency and pricing, partially offset by management actions related to the Association - Financial Institutions block of
business. Excluding the Association - Financial Institutions block of business, fully insured ongoing premiums increased 4% in 2015.
Insurance operating costs and other expenses decreased in 2015, compared to the prior year period, due primarily to lower profit sharing
expense related to the Association - Financial Institutions block of business.
Fully insured ongoing sales, excluding buyouts increased 43% in 2015, as compared to prior year period, primarily due to an increase in
large case accounts.
The total loss ratio increased by 1.2 points in 2015, as compared to the prior year period due to a higher group life loss ratio and the
impact of Association - Financial Institutions business in 2014, partially offset by a lower disability loss ratio. Excluding the
Association - Financial Institutions block of business, the total loss ratio was flat to prior year. Excluding the Association - Financial
Institutions block of business, the life loss ratio increased 1.9 points due to favorable changes in reserve assumptions in 2014 and less
favorable severity in the current year. The disability loss ratio improved 1.9 points due to changes in long term disability reserve
assumptions for claim recoveries which favorably impacted the disability loss ratio by 1.2 points, as well as improved incidence and
pricing partially offset by unfavorable long term disability claim severity.
The expense ratio improved 2.1 points in 2015, compared to the prior year period, primarily due to lower profit sharing expense related
to the Association - Financial Institutions block of business. Excluding the Association - Financial Institutions block of business, the
expense ratio improved 1.1 points reflecting premium growth and lower expenses.
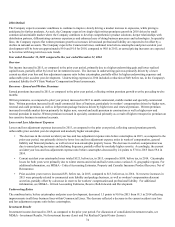
Investment income and net realized capital gains decreased in 2015, as compared to the prior year period. For discussion of consolidated
investment results, see MD&A - Investment Results, Investment Income (Loss) and Net Realized Capital Gains (Losses).
The effective tax rate, in both periods, differs from the U.S. Federal statutory rate primarily due to permanent differences related to
investments in tax exempt securities. For further discussion of income taxes, see Note 14 - Income Taxes of Notes to Consolidated
Financial Statements.
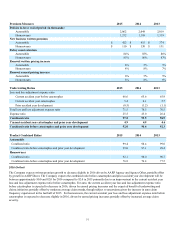
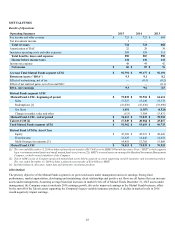
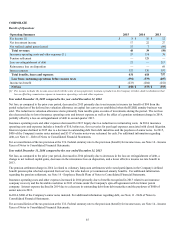
Year ended December 31, 2014 compared to the year ended December 31, 2013
Net income slightly decreased in 2014, as compared to the prior year period, primarily due to lower premiums and other considerations,
net investment income and net realized capital gains, offset by lower benefits, losses and loss adjustment expenses and insurance
operating costs and other expenses.
Premiums and other considerations decreased in 2014, as compared to the prior year period, due primarily to management actions related
to the Association - Financial Institutions block of business. Insurance operating costs and other expenses decreased in 2014, compared
to the prior year period, due primarily to lower profit sharing expense related to the Association - Financial Institutions block of
business.
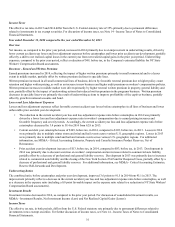
Fully insured ongoing sales, excluding buyouts declined 17% in 2014, as compared to prior year period. Excluding Association -
Financial Institutions block of business, fully insured ongoing sales, excluding buyouts decreased 12% in 2014 primarily due to lower
large case sales.
The total loss ratio increased by 0.6 points in 2014, as compared to the prior year period. Excluding the Association - Financial
Institutions block of business, the loss ratio improved 1.9 points in 2014 due to improvements in both the life and disability loss ratios.
The life loss ratio improvement reflects favorable mortality experience, improved pricing, and the impact of changes in reserve
assumptions. The disability loss ratio improvement reflects improved accident year incidence and pricing partially offset by higher new
claim severity and less favorable development on prior accident year recoveries.
The expense ratio improved 1.7 points in 2014, compared to the prior year period, primarily due to lower profit sharing expense related
to the Association - Financial Institutions block of business in relation to lower premium and other considerations.
Core earnings margin improved 0.9 points in 2014, compared to the prior year period. The improvement was primarily due to the
improved loss ratio excluding the Association - Financial Institutions block of business.
Investment income and net realized capital gains decreased in 2014, as compared to the prior year period. For discussion of consolidated
investment results, see MD&A - Investment Results, Investment Income (Loss) and Net Realized Capital Gains (Losses).
The effective tax rate, in both periods, differs from the U.S. Federal statutory rate primarily due to permanent differences related to
investments in tax exempt securities. For further discussion of income taxes, see Note 14 - Income Taxes of Notes to Consolidated
Financial Statements.