The Hartford 2015 Annual Report Download - page 161
Download and view the complete annual report
Please find page 161 of the 2015 The Hartford annual report below. You can navigate through the pages in the report by either clicking on the pages listed below, or by using the keyword search tool below to find specific information within the annual report.-
 1
1 -
2
-
3
-
4
-
5
-
6
-
7
-
8
-
9
-
10
-
11
-
12
-
13
-
14
-
15
-
16
-
17
-
18
-
19
-
20
-
21
-
22
-
23
-
24
-
25
-
26
-
27
-
28
-
29
-
30
-
31
-
32
-
33
-
34
-
35
-
36
-
37
-
38
-
39
-
40
-
41
-
42
-
43
-
44
-
45
-
46
-
47
-
48
-
49
-
50
-
51
-
52
-
53
-
54
-
55
-
56
-
57
-
58
-
59
-
60
-
61
-
62
-
63
-
64
-
65
-
66
-
67
-
68
-
69
-
70
-
71
-
72
-
73
-
74
-
75
-
76
-
77
-
78
-
79
-
80
-
81
-
82
-
83
-
84
-
85
-
86
-
87
-
88
-
89
-
90
-
91
-
92
-
93
-
94
-
95
-
96
-
97
-
98
-
99
-
100
-
101
-
102
-
103
-
104
-
105
-
106
-
107
-
108
-
109
-
110
-
111
-
112
-
113
-
114
-
115
-
116
-
117
-
118
-
119
-
120
-
121
-
122
-
123
-
124
-
125
-
126
-
127
-
128
-
129
-
130
-
131
-
132
-
133
-
134
-
135
-
136
-
137
-
138
-
139
-
140
-
141
-
142
-
143
-
144
-
145
-
146
-
147
-
148
-
149
-
150
-
 151
151 -
 152
152 -
 153
153 -
 154
154 -
 155
155 -
 156
156 -
 157
157 -
 158
158 -
 159
159 -
 160
160 -
 161
161 -
 162
162 -
 163
163 -
 164
164 -
 165
165 -
 166
166 -
 167
167 -
 168
168 -
 169
169 -
 170
170 -
 171
171 -
172
-
173
-
174
-
175
-
176
-
177
-
178
-
179
-
180
-
181
-
182
-
183
-
184
-
185
-
186
-
187
-
188
-
189
-
190
-
191
-
192
-
193
-
194
-
195
-
196
-
197
-
198
-
199
-
200
-
201
-
202
-
203
-
204
-
205
-
206
-
207
-
208
-
209
-
210
-
211
-
212
-
213
-
214
-
215
-
216
-
217
-
218
-
219
-
220
-
221
-
222
-
223
-
224
-
225
-
226
-
227
-
228
-
229
-
230
-
231
-
232
-
233
-
234
-
235
-
236
-
237
-
238
-
239
-
240
-
241
-
242
-
243
-
244
-
245
-
246
-
247
-
248
-
249
-
250
-
251
-
252
-
253
-
254
-
255
 |
 |

Table of Contents THE HARTFORD FINANCIAL SERVICES GROUP, INC.
NOTES TO CONSOLIDATED FINANCIAL STATEMENTS (continued)
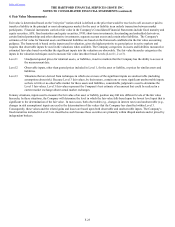
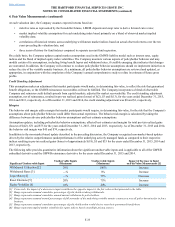
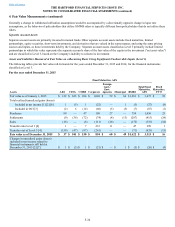
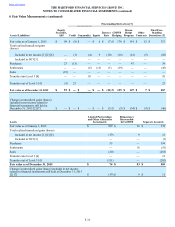
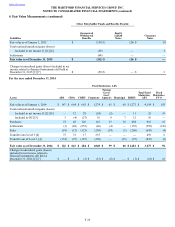
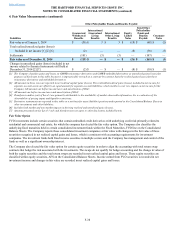
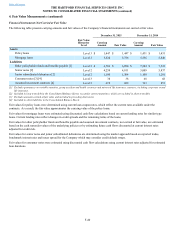
4. Fair Value Measurements (continued)
F-30
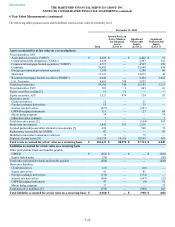
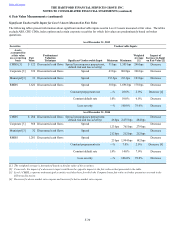
Significant Unobservable Inputs for Level 3 Assets Measured at Fair Value
The following tables present information about significant unobservable inputs used in Level 3 assets measured at fair value. The tables
exclude ABS, CRE CDOs, index options and certain corporate securities for which fair values are predominately based on broker
quotations.
As of December 31, 2015
Securities Unobservable Inputs
Assets
accounted for
at fair value
on a recurring
basis Fair
Value
Predominant
Valuation
Technique Significant Unobservable Input Minimum Maximum
Weighted
Average
[1]
Impact of
Increase in Input
on Fair Value [2]
CMBS [3] $ 122 Discounted cash flows Spread (encompasses prepayment,
default risk and loss severity)
31 bps 1,505 bps 266 bps Decrease
Corporate [3] 339 Discounted cash flows Spread 63 bps 800 bps 306 bps Decrease
Municipal [3] 31 Discounted cash flows Spread 193 bps 193 bps 193 bps Decrease
RMBS 1,622 Discounted cash flows Spread 30 bps 1,696 bps 178 bps Decrease
Constant prepayment rate —% 20.0% 2.0% Decrease [4]
Constant default rate 1.0% 10.0% 6.0% Decrease
Loss severity —% 100.0% 78.0% Decrease
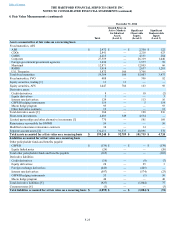
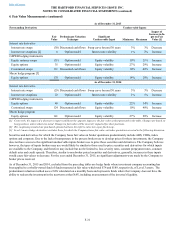
As of December 31, 2014
CMBS $ 284 Discounted cash flows Spread (encompasses prepayment,
default risk and loss severity) 46 bps 2,475 bps 284 bps
Decrease
Corporate [3] 568 Discounted cash flows Spread
123 bps 765 bps 279 bps
Decrease
Municipal [3] 32 Discounted cash flows Spread
212 bps 212 bps 212 bps
Decrease
RMBS 1,281 Discounted cash flows Spread
23 bps 1,904 bps 142 bps
Decrease
Constant prepayment rate —% 7.0% 2.0% Decrease [4]
Constant default rate 1.0% 14.0% 7.0% Decrease
Loss severity —% 100.0% 78.0% Decrease
[1] The weighted average is determined based on the fair value of the securities.
[2] Conversely, the impact of a decrease in input would have the opposite impact to the fair value as that presented in the table.
[3] Level 3 CMBS, corporate and municipal securities excludes those for which the Company bases fair value on broker quotations as noted in the
following discussion.
[4] Decrease for above market rate coupons and increase for below market rate coupons.