The Hartford 2015 Annual Report Download - page 92
Download and view the complete annual report
Please find page 92 of the 2015 The Hartford annual report below. You can navigate through the pages in the report by either clicking on the pages listed below, or by using the keyword search tool below to find specific information within the annual report.-
 1
1 -
2
-
3
-
4
-
5
-
6
-
7
-
8
-
9
-
10
-
11
-
12
-
13
-
14
-
15
-
16
-
17
-
18
-
19
-
20
-
21
-
22
-
23
-
24
-
25
-
26
-
27
-
28
-
29
-
30
-
31
-
32
-
33
-
34
-
35
-
36
-
37
-
38
-
39
-
40
-
41
-
42
-
43
-
44
-
45
-
46
-
47
-
48
-
49
-
50
-
51
-
52
-
53
-
54
-
55
-
56
-
57
-
58
-
59
-
60
-
61
-
62
-
63
-
64
-
65
-
66
-
67
-
68
-
69
-
70
-
71
-
72
-
73
-
74
-
75
-
76
-
77
-
78
-
79
-
80
-
81
-
 82
82 -
 83
83 -
 84
84 -
 85
85 -
 86
86 -
 87
87 -
 88
88 -
 89
89 -
 90
90 -
 91
91 -
 92
92 -
 93
93 -
 94
94 -
 95
95 -
 96
96 -
 97
97 -
 98
98 -
 99
99 -
 100
100 -
 101
101 -
 102
102 -
103
-
104
-
105
-
106
-
107
-
108
-
109
-
110
-
111
-
112
-
113
-
114
-
115
-
116
-
117
-
118
-
119
-
120
-
121
-
122
-
123
-
124
-
125
-
126
-
127
-
128
-
129
-
130
-
131
-
132
-
133
-
134
-
135
-
136
-
137
-
138
-
139
-
140
-
141
-
142
-
143
-
144
-
145
-
146
-
147
-
148
-
149
-
150
-
151
-
152
-
153
-
154
-
155
-
156
-
157
-
158
-
159
-
160
-
161
-
162
-
163
-
164
-
165
-
166
-
167
-
168
-
169
-
170
-
171
-
172
-
173
-
174
-
175
-
176
-
177
-
178
-
179
-
180
-
181
-
182
-
183
-
184
-
185
-
186
-
187
-
188
-
189
-
190
-
191
-
192
-
193
-
194
-
195
-
196
-
197
-
198
-
199
-
200
-
201
-
202
-
203
-
204
-
205
-
206
-
207
-
208
-
209
-
210
-
211
-
212
-
213
-
214
-
215
-
216
-
217
-
218
-
219
-
220
-
221
-
222
-
223
-
224
-
225
-
226
-
227
-
228
-
229
-
230
-
231
-
232
-
233
-
234
-
235
-
236
-
237
-
238
-
239
-
240
-
241
-
242
-
243
-
244
-
245
-
246
-
247
-
248
-
249
-
250
-
251
-
252
-
253
-
254
-
255
 |
 |

92
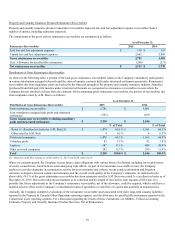
Property and Casualty Insurance Product Reinsurance Recoverables
Property and casualty insurance product reinsurance recoverables represent loss and loss adjustment expense recoverables from a
number of entities, including reinsurers and pools.
The components of the gross and net reinsurance recoverables are summarized as follows:
As of December 31,
Reinsurance Recoverables 2015 2014
Paid loss and loss adjustment expenses $ 119 $ 133
Unpaid loss and loss adjustment expenses 2,662 2,868
Gross reinsurance recoverables 2,781 3,001
Less: Allowance for uncollectible reinsurance (266) (271)
Net reinsurance recoverables $ 2,515 $ 2,730
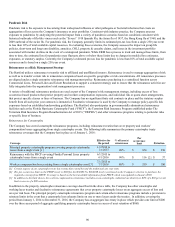
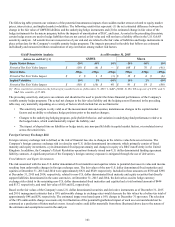
Distribution of Gross Reinsurance Recoverables
As shown in the following table, a portion of the total gross reinsurance recoverables relates to the Company’s mandatory participation
in various involuntary assigned risk pools and the value of annuity contracts held under structured settlement agreements. Reinsurance
recoverables due from mandatory pools are backed by the financial strength of the property and casualty insurance industry. Annuities
purchased from third-party life insurers under structured settlements are recognized as reinsurance recoverables in cases where the
Company has not obtained a release from the claimant. Of the remaining gross reinsurance recoverables, the portion of recoverables due
from companies rated by A.M. Best is as follows:
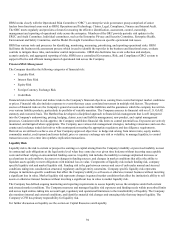
As of December 31,
Distribution of Gross Reinsurance Recoverables 2015 2014
Gross reinsurance recoverables $ 2,781 $ 3,001
Less: mandatory (assigned risk) pools and structured
settlements (551)(567)
Gross reinsurance recoverables excluding mandatory
pools and structured settlements $ 2,230 $ 2,434
% of Total % of Total
Rated A- (Excellent) or better by A.M. Best [1] $ 1,474 66.1 % $ 1,561 64.1 %
Other rated by A.M. Best 4 0.2 % 4 0.2 %
Total rated companies 1,478 66.3 % 1,565 64.3 %
Voluntary pools 82 3.7 % 92 3.8 %
Captives 387 17.3 % 488 20.0 %
Other not rated companies 283 12.7 % 289 11.9 %
Total $ 2,230 100.0% $ 2,434 100.0%
[1] Based on A.M. Best ratings as of December 31, 2015 and 2014, respectively.
Where its contracts permit, the Company secures future claim obligations with various forms of collateral, including irrevocable letters
of credit, secured trusts, funds held accounts and group wide offsets. As part of its reinsurance recoverable review, the Company
analyzes recent developments in commutation activity between reinsurers and cedants, recent trends in arbitration and litigation
outcomes in disputes between cedants and reinsurers and the overall credit quality of the Company’s reinsurers. As indicated in the
above table, 66.1% of the gross reinsurance recoverables due from reinsurers rated by A.M. Best were rated A- (excellent) or better as of
December 31, 2015. Due to the inherent uncertainties as to collection and the length of time before such amounts will be due, it is
possible that future adjustments to the Company’s reinsurance recoverables, net of the allowance, could be required, which could have a
material adverse effect on the Company’s consolidated results of operations or cash flows in a particular quarterly or annual period.
Annually, the Company completes evaluations of the reinsurance recoverable asset associated with older, long-term casualty liabilities
reported in the Property & Casualty Other Operations reporting segment, and the allowance for uncollectible reinsurance reported in the
Commercial Lines reporting segment. For a discussion regarding the results of these evaluations, see MD&A - Critical Accounting
Estimates, Property and Casualty Insurance Product Reserves, Net of Reinsurance.