The Hartford 2015 Annual Report Download - page 176
Download and view the complete annual report
Please find page 176 of the 2015 The Hartford annual report below. You can navigate through the pages in the report by either clicking on the pages listed below, or by using the keyword search tool below to find specific information within the annual report.-
 1
1 -
2
-
3
-
4
-
5
-
6
-
7
-
8
-
9
-
10
-
11
-
12
-
13
-
14
-
15
-
16
-
17
-
18
-
19
-
20
-
21
-
22
-
23
-
24
-
25
-
26
-
27
-
28
-
29
-
30
-
31
-
32
-
33
-
34
-
35
-
36
-
37
-
38
-
39
-
40
-
41
-
42
-
43
-
44
-
45
-
46
-
47
-
48
-
49
-
50
-
51
-
52
-
53
-
54
-
55
-
56
-
57
-
58
-
59
-
60
-
61
-
62
-
63
-
64
-
65
-
66
-
67
-
68
-
69
-
70
-
71
-
72
-
73
-
74
-
75
-
76
-
77
-
78
-
79
-
80
-
81
-
82
-
83
-
84
-
85
-
86
-
87
-
88
-
89
-
90
-
91
-
92
-
93
-
94
-
95
-
96
-
97
-
98
-
99
-
100
-
101
-
102
-
103
-
104
-
105
-
106
-
107
-
108
-
109
-
110
-
111
-
112
-
113
-
114
-
115
-
116
-
117
-
118
-
119
-
120
-
121
-
122
-
123
-
124
-
125
-
126
-
127
-
128
-
129
-
130
-
131
-
132
-
133
-
134
-
135
-
136
-
137
-
138
-
139
-
140
-
141
-
142
-
143
-
144
-
145
-
146
-
147
-
148
-
149
-
150
-
151
-
152
-
153
-
154
-
155
-
156
-
157
-
158
-
159
-
160
-
161
-
162
-
163
-
164
-
165
-
 166
166 -
 167
167 -
 168
168 -
 169
169 -
 170
170 -
 171
171 -
 172
172 -
 173
173 -
 174
174 -
 175
175 -
 176
176 -
 177
177 -
 178
178 -
 179
179 -
 180
180 -
 181
181 -
 182
182 -
 183
183 -
 184
184 -
 185
185 -
 186
186 -
187
-
188
-
189
-
190
-
191
-
192
-
193
-
194
-
195
-
196
-
197
-
198
-
199
-
200
-
201
-
202
-
203
-
204
-
205
-
206
-
207
-
208
-
209
-
210
-
211
-
212
-
213
-
214
-
215
-
216
-
217
-
218
-
219
-
220
-
221
-
222
-
223
-
224
-
225
-
226
-
227
-
228
-
229
-
230
-
231
-
232
-
233
-
234
-
235
-
236
-
237
-
238
-
239
-
240
-
241
-
242
-
243
-
244
-
245
-
246
-
247
-
248
-
249
-
250
-
251
-
252
-
253
-
254
-
255
 |
 |

Table of Contents THE HARTFORD FINANCIAL SERVICES GROUP, INC.
NOTES TO CONSOLIDATED FINANCIAL STATEMENTS (continued)
6. Investments and Derivative Instruments (continued)
F-45
For equity securities where the decline in the fair value is deemed to be other-than-temporary, a charge is recorded in net realized capital
losses equal to the difference between the fair value and cost basis of the security. The previous cost basis less the impairment becomes
the security’s new cost basis. The Company asserts its intent and ability to retain those equity securities deemed to be temporarily
impaired until the price recovers. Once identified, these securities are systematically restricted from trading unless approved by
investment and accounting professionals. The investment and accounting professionals will only authorize the sale of these securities
based on predefined criteria that relate to events that could not have been reasonably foreseen. Examples of the criteria include, but are
not limited to, the deterioration in the issuer’s financial condition, security price declines, a change in regulatory requirements or a major
business combination or major disposition.
The primary factors considered in evaluating whether an impairment exists for an equity security include, but are not limited to: (a) the
length of time and extent to which the fair value has been less than the cost of the security, (b) changes in the financial condition, credit
rating and near-term prospects of the issuer, (c) whether the issuer is current on preferred stock dividends and (d) the intent and ability of
the Company to retain the investment for a period of time sufficient to allow for recovery.
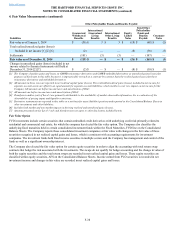
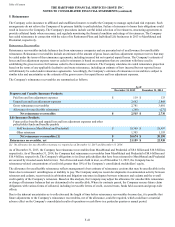
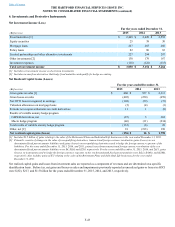
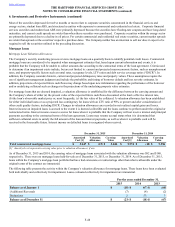
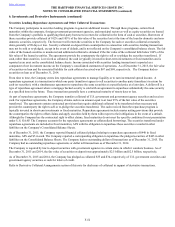
The following table presents the Company's impairments by impairment type.
For the years ended December 31,
2015 2014 2013
Intent-to-sell impairments $ 54 $ 17 $ 26
Credit impairments 29 37 32
Impairments on equity securities 16 2 15
Other impairments 3 3 —
Total impairments $ 102 $ 59 $ 73
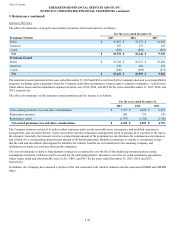
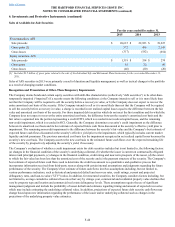
The following table presents a roll-forward of the Company’s cumulative credit impairments on fixed maturities held.
For the years ended December 31,
(Before-tax) 2015 2014 2013
Balance as of beginning of period $ (424) $ (552) $ (1,013)
Additions for credit impairments recognized on [1]:
Securities not previously impaired (15)(15) (19)
Securities previously impaired (14)(22) (13)
Reductions for credit impairments previously recognized on:
Securities that matured or were sold during the period 68 138 469
Securities the Company made the decision to sell or more likely than not will be
required to sell 2 — 2
Securities due to an increase in expected cash flows 59 27 22
Balance as of end of period $ (324) $ (424) $ (552)
[1] These additions are included in the net OTTI losses recognized in earnings in the Consolidated Statements of Operations.