The Hartford 2015 Annual Report Download - page 160
Download and view the complete annual report
Please find page 160 of the 2015 The Hartford annual report below. You can navigate through the pages in the report by either clicking on the pages listed below, or by using the keyword search tool below to find specific information within the annual report.-
 1
1 -
2
-
3
-
4
-
5
-
6
-
7
-
8
-
9
-
10
-
11
-
12
-
13
-
14
-
15
-
16
-
17
-
18
-
19
-
20
-
21
-
22
-
23
-
24
-
25
-
26
-
27
-
28
-
29
-
30
-
31
-
32
-
33
-
34
-
35
-
36
-
37
-
38
-
39
-
40
-
41
-
42
-
43
-
44
-
45
-
46
-
47
-
48
-
49
-
50
-
51
-
52
-
53
-
54
-
55
-
56
-
57
-
58
-
59
-
60
-
61
-
62
-
63
-
64
-
65
-
66
-
67
-
68
-
69
-
70
-
71
-
72
-
73
-
74
-
75
-
76
-
77
-
78
-
79
-
80
-
81
-
82
-
83
-
84
-
85
-
86
-
87
-
88
-
89
-
90
-
91
-
92
-
93
-
94
-
95
-
96
-
97
-
98
-
99
-
100
-
101
-
102
-
103
-
104
-
105
-
106
-
107
-
108
-
109
-
110
-
111
-
112
-
113
-
114
-
115
-
116
-
117
-
118
-
119
-
120
-
121
-
122
-
123
-
124
-
125
-
126
-
127
-
128
-
129
-
130
-
131
-
132
-
133
-
134
-
135
-
136
-
137
-
138
-
139
-
140
-
141
-
142
-
143
-
144
-
145
-
146
-
147
-
148
-
149
-
 150
150 -
 151
151 -
 152
152 -
 153
153 -
 154
154 -
 155
155 -
 156
156 -
 157
157 -
 158
158 -
 159
159 -
 160
160 -
 161
161 -
 162
162 -
 163
163 -
 164
164 -
 165
165 -
 166
166 -
 167
167 -
 168
168 -
 169
169 -
 170
170 -
171
-
172
-
173
-
174
-
175
-
176
-
177
-
178
-
179
-
180
-
181
-
182
-
183
-
184
-
185
-
186
-
187
-
188
-
189
-
190
-
191
-
192
-
193
-
194
-
195
-
196
-
197
-
198
-
199
-
200
-
201
-
202
-
203
-
204
-
205
-
206
-
207
-
208
-
209
-
210
-
211
-
212
-
213
-
214
-
215
-
216
-
217
-
218
-
219
-
220
-
221
-
222
-
223
-
224
-
225
-
226
-
227
-
228
-
229
-
230
-
231
-
232
-
233
-
234
-
235
-
236
-
237
-
238
-
239
-
240
-
241
-
242
-
243
-
244
-
245
-
246
-
247
-
248
-
249
-
250
-
251
-
252
-
253
-
254
-
255
 |
 |

Table of Contents THE HARTFORD FINANCIAL SERVICES GROUP, INC.
NOTES TO CONSOLIDATED FINANCIAL STATEMENTS (continued)
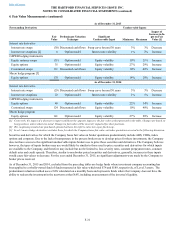
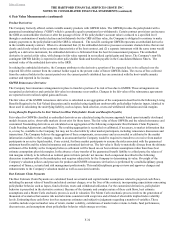
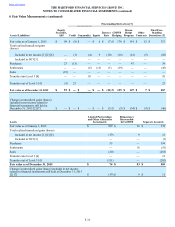
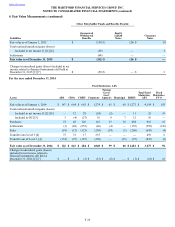
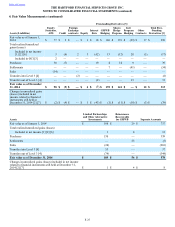
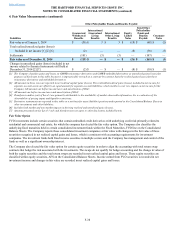
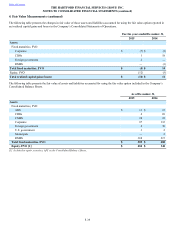
4. Fair Value Measurements (continued)
F-29
Level 3 Most of the Company's securities classified as Level 3 include less liquid securities such as lower quality ABS, CMBS,
commercial real estate ("CRE") CDOs and RMBS primarily backed by sub-prime loans. Also included in Level 3 are
securities valued based on broker prices or broker spreads, without adjustments. Primary inputs for non-broker priced
investments, including structured securities, are consistent with the typical inputs used in the preceding noted Level 2
measurements, but are Level 3 due to their less liquid markets. Additionally, certain long-dated securities are priced based
on third party pricing services, including certain municipal securities, foreign government/government agency securities,
and bank loans. Primary inputs for these long-dated securities are consistent with the typical inputs used in the preceding
noted Level 1 and Level 2 measurements, but include benchmark interest rate or credit spread assumptions that are not
observable in the marketplace. Significant inputs for Level 3 derivative contracts primarily include the typical inputs used
in the preceding noted Level 1 and Level 2 measurements; but also include equity and interest rate volatility and swap yield
curves beyond observable limits, and commodity price curves.
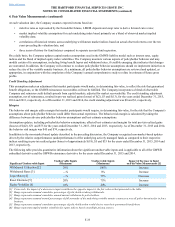
Level 3 investments also include hedge funds where investment company accounting has been applied to a wholly-owned
fund of funds measured at fair value where the Company does not have the ability to redeem the investment in the near-
term at the NAV. Also included in Level 3 are certain derivative instruments that either have significant unobservable
inputs or are valued based on broker quotations.
Transfers between Levels
Transfers of securities among the levels occur at the beginning of the reporting period. The amount of transfers from Level 1 to Level 2
was $1.9 billion and $2.5 billion, for the years ended December 31, 2015 and 2014, respectively, which represented previously on-the-
run U.S. Treasury securities that are now off-the-run. For the years ended December 31, 2015 and 2014, there were no transfers from
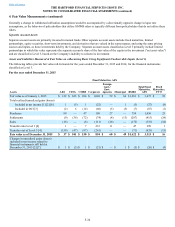
Level 2 to Level 1. See the fair value roll-forward tables for the years ended December 31, 2015 and 2014, for the transfers into and out
of Level 3.