The Hartford 2015 Annual Report Download - page 102
Download and view the complete annual report
Please find page 102 of the 2015 The Hartford annual report below. You can navigate through the pages in the report by either clicking on the pages listed below, or by using the keyword search tool below to find specific information within the annual report.-
 1
1 -
2
-
3
-
4
-
5
-
6
-
7
-
8
-
9
-
10
-
11
-
12
-
13
-
14
-
15
-
16
-
17
-
18
-
19
-
20
-
21
-
22
-
23
-
24
-
25
-
26
-
27
-
28
-
29
-
30
-
31
-
32
-
33
-
34
-
35
-
36
-
37
-
38
-
39
-
40
-
41
-
42
-
43
-
44
-
45
-
46
-
47
-
48
-
49
-
50
-
51
-
52
-
53
-
54
-
55
-
56
-
57
-
58
-
59
-
60
-
61
-
62
-
63
-
64
-
65
-
66
-
67
-
68
-
69
-
70
-
71
-
72
-
73
-
74
-
75
-
76
-
77
-
78
-
79
-
80
-
81
-
82
-
83
-
84
-
85
-
86
-
87
-
88
-
89
-
90
-
91
-
 92
92 -
 93
93 -
 94
94 -
 95
95 -
 96
96 -
 97
97 -
 98
98 -
 99
99 -
 100
100 -
 101
101 -
 102
102 -
 103
103 -
 104
104 -
 105
105 -
 106
106 -
 107
107 -
 108
108 -
 109
109 -
 110
110 -
 111
111 -
 112
112 -
113
-
114
-
115
-
116
-
117
-
118
-
119
-
120
-
121
-
122
-
123
-
124
-
125
-
126
-
127
-
128
-
129
-
130
-
131
-
132
-
133
-
134
-
135
-
136
-
137
-
138
-
139
-
140
-
141
-
142
-
143
-
144
-
145
-
146
-
147
-
148
-
149
-
150
-
151
-
152
-
153
-
154
-
155
-
156
-
157
-
158
-
159
-
160
-
161
-
162
-
163
-
164
-
165
-
166
-
167
-
168
-
169
-
170
-
171
-
172
-
173
-
174
-
175
-
176
-
177
-
178
-
179
-
180
-
181
-
182
-
183
-
184
-
185
-
186
-
187
-
188
-
189
-
190
-
191
-
192
-
193
-
194
-
195
-
196
-
197
-
198
-
199
-
200
-
201
-
202
-
203
-
204
-
205
-
206
-
207
-
208
-
209
-
210
-
211
-
212
-
213
-
214
-
215
-
216
-
217
-
218
-
219
-
220
-
221
-
222
-
223
-
224
-
225
-
226
-
227
-
228
-
229
-
230
-
231
-
232
-
233
-
234
-
235
-
236
-
237
-
238
-
239
-
240
-
241
-
242
-
243
-
244
-
245
-
246
-
247
-
248
-
249
-
250
-
251
-
252
-
253
-
254
-
255
 |
 |
102
Liabilities
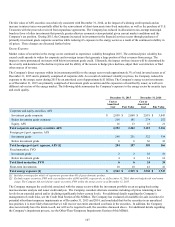
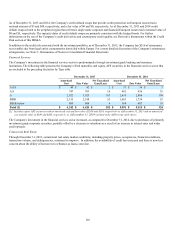
The Company has foreign currency exchange risk associated with yen denominated fixed payout annuities under a reinsurance contract.
The Company has entered into pay U.S. dollar, receive yen swap contracts to hedge the currency exposure between the U.S. dollar
denominated assets and the yen denominated fixed liability reinsurance payments. In addition, during 2015, the Company entered into
certain foreign currency forwards to hedge the currency impacts on changes in equity of a P&C runoff entity in the United Kingdom. At
December 31, 2015 the derivatives used to hedge the currency impacts had a total notional amount of $191 and a total fair value of $6.
Talcott Resolution previously issued non-U.S. dollar denominated funding agreement liability contracts. The Company hedged the
foreign currency risk associated with these liability contracts with currency rate swaps. At December 31, 2015 and 2014, the derivatives
used to hedge foreign currency exchange risk related to foreign denominated liability contracts had a total notional amount of $94, and a
total fair value of $(26) and $(20), respectively.
Financial Risk on Statutory Capital
Statutory surplus amounts and risk-based capital (“RBC”) ratios may increase or decrease in any period depending upon a variety of
factors and may be compounded in extreme scenarios or if multiple factors occur at the same time. At times the impact of changes in
certain market factors or a combination of multiple factors on RBC ratios can be counterintuitive. Factors include:
• In general, as equity market levels and interest rates decline, the amount and volatility of both our actual potential obligation, as
well as the related statutory surplus and capital margin for death and living benefit guarantees associated with variable annuity
contracts can be materially negatively affected, sometimes at a greater than linear rate. Other market factors that can impact
statutory surplus, reserve levels and capital margin include differences in performance of variable subaccounts relative to
indices and/or realized equity and interest rate volatilities. In addition, as equity market levels increase, generally surplus levels
will increase. RBC ratios will also tend to increase when equity markets increase. However, as a result of a number of factors
and market conditions, including the level of hedging costs and other risk transfer activities, reserve requirements for death and
living benefit guarantees and RBC requirements could increase with rising equity markets, resulting in lower RBC ratios. Non-
market factors, which can also impact the amount and volatility of both our actual potential obligation, as well as the related
statutory surplus and capital margin, include actual and estimated policyholder behavior experience as it pertains to lapsation,
partial withdrawals, and mortality.
• As the value of certain fixed-income and equity securities in our investment portfolio decreases, due in part to credit spread
widening, statutory surplus and RBC ratios may decrease.
• As the value of certain derivative instruments that do not get hedge accounting decreases, statutory surplus and RBC ratios may
decrease.
• Our statutory surplus is also impacted by widening credit spreads as a result of the accounting for the assets and liabilities in
our fixed MVA annuities. Statutory separate account assets supporting the fixed MVA annuities are recorded at fair value. In
determining the statutory reserve for the fixed MVA annuities, we are required to use current crediting rates. In many capital
market scenarios, current crediting rates are highly correlated with market rates implicit in the fair value of statutory separate
account assets. As a result, the change in statutory reserve from period to period will likely substantially offset the change in the
fair value of the statutory separate account assets. However, in periods of volatile credit markets, actual credit spreads on
investment assets may increase sharply for certain sub-sectors of the overall credit market, resulting in statutory separate
account asset market value losses. As actual credit spreads are not fully reflected in the current crediting rates the calculation of
statutory reserves will not substantially offset the change in fair value of the statutory separate account assets resulting in
reductions in statutory surplus. This has resulted and may continue to result in the need to devote significant additional capital
to support the product.
• With respect to our fixed annuity business, sustained low interest rates may result in a reduction in statutory surplus and an
increase in NAIC required capital.
Most of these factors are outside of the Company’s control. The Company’s financial strength and credit ratings are significantly
influenced by the statutory surplus amounts and RBC ratios of our insurance company subsidiaries. In addition, rating agencies may
implement changes to their internal models that have the effect of increasing or decreasing the amount of statutory capital we must hold
in order to maintain our current ratings.
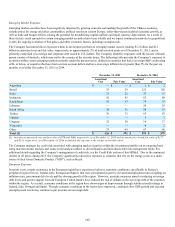
The Company has reinsured approximately 33% of its risk associated with GMWB and 74% of its risk associated with the aggregate
GMDB exposure. These reinsurance agreements serve to reduce the Company’s exposure to changes in the statutory reserves and the
related capital and RBC ratios associated with changes in the capital markets. The Company also continues to explore other solutions for
mitigating the capital market risk effect on surplus, such as internal and external reinsurance solutions, modifications to our hedging
program, changes in product design and expense management.