The Hartford 2015 Annual Report Download - page 191
Download and view the complete annual report
Please find page 191 of the 2015 The Hartford annual report below. You can navigate through the pages in the report by either clicking on the pages listed below, or by using the keyword search tool below to find specific information within the annual report.-
 1
1 -
2
-
3
-
4
-
5
-
6
-
7
-
8
-
9
-
10
-
11
-
12
-
13
-
14
-
15
-
16
-
17
-
18
-
19
-
20
-
21
-
22
-
23
-
24
-
25
-
26
-
27
-
28
-
29
-
30
-
31
-
32
-
33
-
34
-
35
-
36
-
37
-
38
-
39
-
40
-
41
-
42
-
43
-
44
-
45
-
46
-
47
-
48
-
49
-
50
-
51
-
52
-
53
-
54
-
55
-
56
-
57
-
58
-
59
-
60
-
61
-
62
-
63
-
64
-
65
-
66
-
67
-
68
-
69
-
70
-
71
-
72
-
73
-
74
-
75
-
76
-
77
-
78
-
79
-
80
-
81
-
82
-
83
-
84
-
85
-
86
-
87
-
88
-
89
-
90
-
91
-
92
-
93
-
94
-
95
-
96
-
97
-
98
-
99
-
100
-
101
-
102
-
103
-
104
-
105
-
106
-
107
-
108
-
109
-
110
-
111
-
112
-
113
-
114
-
115
-
116
-
117
-
118
-
119
-
120
-
121
-
122
-
123
-
124
-
125
-
126
-
127
-
128
-
129
-
130
-
131
-
132
-
133
-
134
-
135
-
136
-
137
-
138
-
139
-
140
-
141
-
142
-
143
-
144
-
145
-
146
-
147
-
148
-
149
-
150
-
151
-
152
-
153
-
154
-
155
-
156
-
157
-
158
-
159
-
160
-
161
-
162
-
163
-
164
-
165
-
166
-
167
-
168
-
169
-
170
-
171
-
172
-
173
-
174
-
175
-
176
-
177
-
178
-
179
-
180
-
 181
181 -
 182
182 -
 183
183 -
 184
184 -
 185
185 -
 186
186 -
 187
187 -
 188
188 -
 189
189 -
 190
190 -
 191
191 -
 192
192 -
 193
193 -
 194
194 -
 195
195 -
 196
196 -
 197
197 -
 198
198 -
 199
199 -
 200
200 -
 201
201 -
202
-
203
-
204
-
205
-
206
-
207
-
208
-
209
-
210
-
211
-
212
-
213
-
214
-
215
-
216
-
217
-
218
-
219
-
220
-
221
-
222
-
223
-
224
-
225
-
226
-
227
-
228
-
229
-
230
-
231
-
232
-
233
-
234
-
235
-
236
-
237
-
238
-
239
-
240
-
241
-
242
-
243
-
244
-
245
-
246
-
247
-
248
-
249
-
250
-
251
-
252
-
253
-
254
-
255
 |
 |

Table of Contents THE HARTFORD FINANCIAL SERVICES GROUP, INC.
NOTES TO CONSOLIDATED FINANCIAL STATEMENTS (continued)
6. Investments and Derivative Instruments (continued)
F-60
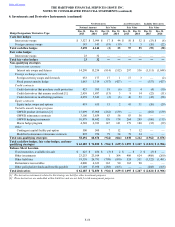
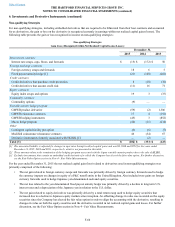
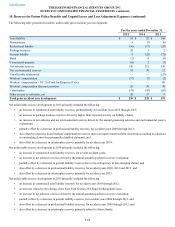
Non-qualifying Strategies
For non-qualifying strategies, including embedded derivatives that are required to be bifurcated from their host contracts and accounted
for as derivatives, the gain or loss on the derivative is recognized currently in earnings within net realized capital gains (losses). The
following table presents the gain or loss recognized in income on non-qualifying strategies:
Non-qualifying Strategies
Gain (Loss) Recognized within Net Realized Capital Gains (Losses)
December 31,
2015 2014 2013
Interest rate contracts
Interest rate swaps, caps, floors, and forwards $ (15) $ (172) $ 50
Foreign exchange contracts
Foreign currency swaps and forwards 18 6 5
Fixed payout annuity hedge [1] (21)(148) (268)
Credit contracts
Credit derivatives that purchase credit protection 8 (10) (38)
Credit derivatives that assume credit risk (11) 16 71
Equity contracts
Equity index swaps and options 19 3 (33)
Commodity contracts
Commodity options (9) — —
Variable annuity hedge program
GMWB product derivative (59)(2) 1,306
GMWB reinsurance contracts 17 4 (192)
GMWB hedging instruments (45) 3 (852)
Macro hedge program (46)(11) (234)
Other
Contingent capital facility put option (6)(6) (7)
Modified coinsurance reinsurance contracts 46 (34) 67
Derivative instruments formerly associated with HLIKK [2] — (2) —
Total [3] $ (104) $ (353) $ (125)
[1] The associated liability is adjusted for changes in spot rates through realized capital gains and was $4, $116 and $250 for the years ended
December 31, 2015, 2014 and 2013, respectively, which is not presented in this table
[2] These amounts relate to the termination of the hedging program associated with the Japan variable annuity product due to the sale of HLIKK.
[3] Excludes investments that contain an embedded credit derivative for which the Company has elected the fair value option. For further discussion,
see the Fair Value Option section in Note 4 - Fair Value Measurements.
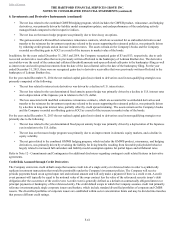
For the year ended December 31, 2015 the net realized capital gain (loss) related to derivatives used in non-qualifying strategies was
primarily comprised of the following:
• The net gain related to foreign currency swaps and forwards was primarily driven by foreign currency forwards used to hedge
the currency impacts on changes in equity of a P&C runoff entity in the United Kingdom. Also included were gains on foreign
currency forwards used to hedge Japanese yen-denominated cash and equity securities.
• The net loss related to the yen denominated fixed payout annuity hedge was primarily driven by a decline in long term U.S.
interest rates and a depreciation of the Japanese yen in relation to the U.S. dollar.
• The net gain related to equity derivatives was primarily driven by a total return swap used to hedge equity securities that
increased due to a decline in Japanese equity markets since inception. An offsetting change in value was recorded on the equity
securities since the Company has elected the fair value option in order to align the accounting with the derivative, resulting in
changes in value on both the equity securities and the derivative recorded in net realized capital gains and losses. For further
discussion, see the Fair Value Option section in Note 4 - Fair Value Measurements.