The Hartford 2015 Annual Report Download - page 42
Download and view the complete annual report
Please find page 42 of the 2015 The Hartford annual report below. You can navigate through the pages in the report by either clicking on the pages listed below, or by using the keyword search tool below to find specific information within the annual report.-
 1
1 -
2
-
3
-
4
-
5
-
6
-
7
-
8
-
9
-
10
-
11
-
12
-
13
-
14
-
15
-
16
-
17
-
18
-
19
-
20
-
21
-
22
-
23
-
24
-
25
-
26
-
27
-
28
-
29
-
30
-
31
-
 32
32 -
 33
33 -
 34
34 -
 35
35 -
 36
36 -
 37
37 -
 38
38 -
 39
39 -
 40
40 -
 41
41 -
 42
42 -
 43
43 -
 44
44 -
 45
45 -
 46
46 -
 47
47 -
 48
48 -
 49
49 -
 50
50 -
 51
51 -
 52
52 -
53
-
54
-
55
-
56
-
57
-
58
-
59
-
60
-
61
-
62
-
63
-
64
-
65
-
66
-
67
-
68
-
69
-
70
-
71
-
72
-
73
-
74
-
75
-
76
-
77
-
78
-
79
-
80
-
81
-
82
-
83
-
84
-
85
-
86
-
87
-
88
-
89
-
90
-
91
-
92
-
93
-
94
-
95
-
96
-
97
-
98
-
99
-
100
-
101
-
102
-
103
-
104
-
105
-
106
-
107
-
108
-
109
-
110
-
111
-
112
-
113
-
114
-
115
-
116
-
117
-
118
-
119
-
120
-
121
-
122
-
123
-
124
-
125
-
126
-
127
-
128
-
129
-
130
-
131
-
132
-
133
-
134
-
135
-
136
-
137
-
138
-
139
-
140
-
141
-
142
-
143
-
144
-
145
-
146
-
147
-
148
-
149
-
150
-
151
-
152
-
153
-
154
-
155
-
156
-
157
-
158
-
159
-
160
-
161
-
162
-
163
-
164
-
165
-
166
-
167
-
168
-
169
-
170
-
171
-
172
-
173
-
174
-
175
-
176
-
177
-
178
-
179
-
180
-
181
-
182
-
183
-
184
-
185
-
186
-
187
-
188
-
189
-
190
-
191
-
192
-
193
-
194
-
195
-
196
-
197
-
198
-
199
-
200
-
201
-
202
-
203
-
204
-
205
-
206
-
207
-
208
-
209
-
210
-
211
-
212
-
213
-
214
-
215
-
216
-
217
-
218
-
219
-
220
-
221
-
222
-
223
-
224
-
225
-
226
-
227
-
228
-
229
-
230
-
231
-
232
-
233
-
234
-
235
-
236
-
237
-
238
-
239
-
240
-
241
-
242
-
243
-
244
-
245
-
246
-
247
-
248
-
249
-
250
-
251
-
252
-
253
-
254
-
255
 |
 |
42
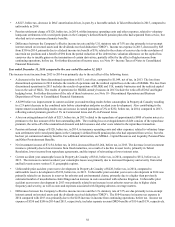
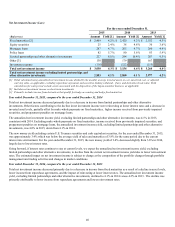
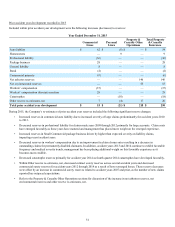
• For the year ended December 31, 2014, the gain related to the combined GMWB derivatives, net, which include the GMWB
product, reinsurance, and hedging derivatives, was primarily driven by gains of $25 on liability/model assumption updates and gains
of $15 due to increased volatility, partially offset by a loss of $26 resulting from policyholder behavior primarily related to increased
surrenders. The loss on the macro hedge program for the year ended December 31, 2014 was primarily due to a loss of $25 driven
by an improvement in the domestic equity markets, partially offset by a gain of $17 related to a decrease in interest rates.
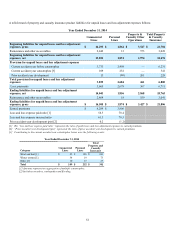
• For the year ended December 31, 2013 the gain on GMWB related derivatives, net, was primarily related to gains of $203 from
revaluing the liability for living benefits largely driven by favorable policyholder behavior related to increased surrenders and gains
of $38 due to liability assumption updates for lapses and withdrawal rates. The loss on the macro hedge program for the year ended
December 31, 2013 was primarily driven by losses of $114 due to an improvement in domestic equity markets, losses of $56 related
to an increase in interest rates, and losses of $31 related to a decrease in equity market volatility.
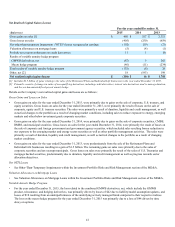
Other, net
• Other, net gain for the year ended December 31, 2015 was primarily related to gains of $46 related to modified coinsurance
reinsurance contracts, primarily driven by widening credit spreads and an increase in interest rates. Modified coinsurance
reinsurance contracts are accounted for as embedded derivatives and transfer to the reinsurer the investment experience related to
the assets supporting the reinsured policies. Also included were gains of $15 on currency derivatives primarily driven by
appreciation of the British pound in comparison to the U.S. dollar. These gains were partially offset by losses of $16 related to fixed
payout annuity hedges primarily driven by an increase in U.S. interest rates, losses of $14 on credit derivatives driven by widening
credit spreads, and losses of $12 on interest rate derivatives due to an increase in interest rates.
• Other, net loss for the year ended December 31, 2014 was primarily related to a loss of $172 on interest rate derivatives used to
manage the risk of a rise in interest rates and manage duration, driven by a decline in U.S. interest rates.
• Other, net gain for the year ended December 31, 2013 was primarily related to gains of $71 on interest rate derivatives primarily
associated with fixed rate bonds sold as part of the Individual Life and Retirement Plan business dispositions. For further
information on the business dispositions, see Note 18 of Notes to the Consolidated Financial Statements. Additional gains included
$69 on interest rate derivatives primarily due to an increase in U.S. interest rates and $42 of gains on credit derivatives due to credit
spreads tightening.