The Hartford 2015 Annual Report Download - page 101
Download and view the complete annual report
Please find page 101 of the 2015 The Hartford annual report below. You can navigate through the pages in the report by either clicking on the pages listed below, or by using the keyword search tool below to find specific information within the annual report.-
 1
1 -
2
-
3
-
4
-
5
-
6
-
7
-
8
-
9
-
10
-
11
-
12
-
13
-
14
-
15
-
16
-
17
-
18
-
19
-
20
-
21
-
22
-
23
-
24
-
25
-
26
-
27
-
28
-
29
-
30
-
31
-
32
-
33
-
34
-
35
-
36
-
37
-
38
-
39
-
40
-
41
-
42
-
43
-
44
-
45
-
46
-
47
-
48
-
49
-
50
-
51
-
52
-
53
-
54
-
55
-
56
-
57
-
58
-
59
-
60
-
61
-
62
-
63
-
64
-
65
-
66
-
67
-
68
-
69
-
70
-
71
-
72
-
73
-
74
-
75
-
76
-
77
-
78
-
79
-
80
-
81
-
82
-
83
-
84
-
85
-
86
-
87
-
88
-
89
-
90
-
 91
91 -
 92
92 -
 93
93 -
 94
94 -
 95
95 -
 96
96 -
 97
97 -
 98
98 -
 99
99 -
 100
100 -
 101
101 -
 102
102 -
 103
103 -
 104
104 -
 105
105 -
 106
106 -
 107
107 -
 108
108 -
 109
109 -
 110
110 -
 111
111 -
112
-
113
-
114
-
115
-
116
-
117
-
118
-
119
-
120
-
121
-
122
-
123
-
124
-
125
-
126
-
127
-
128
-
129
-
130
-
131
-
132
-
133
-
134
-
135
-
136
-
137
-
138
-
139
-
140
-
141
-
142
-
143
-
144
-
145
-
146
-
147
-
148
-
149
-
150
-
151
-
152
-
153
-
154
-
155
-
156
-
157
-
158
-
159
-
160
-
161
-
162
-
163
-
164
-
165
-
166
-
167
-
168
-
169
-
170
-
171
-
172
-
173
-
174
-
175
-
176
-
177
-
178
-
179
-
180
-
181
-
182
-
183
-
184
-
185
-
186
-
187
-
188
-
189
-
190
-
191
-
192
-
193
-
194
-
195
-
196
-
197
-
198
-
199
-
200
-
201
-
202
-
203
-
204
-
205
-
206
-
207
-
208
-
209
-
210
-
211
-
212
-
213
-
214
-
215
-
216
-
217
-
218
-
219
-
220
-
221
-
222
-
223
-
224
-
225
-
226
-
227
-
228
-
229
-
230
-
231
-
232
-
233
-
234
-
235
-
236
-
237
-
238
-
239
-
240
-
241
-
242
-
243
-
244
-
245
-
246
-
247
-
248
-
249
-
250
-
251
-
252
-
253
-
254
-
255
 |
 |

101
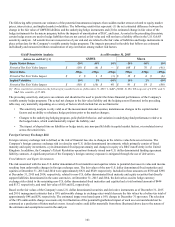
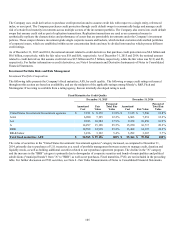
The following table presents our estimates of the potential instantaneous impacts from sudden market stresses related to equity market
prices, interest rates, and implied market volatilities. The following sensitivities represent: (1) the net estimated difference between the
change in the fair value of GMWB liabilities and the underlying hedge instruments and (2) the estimated change in fair value of the
hedge instruments for the macro program, before the impacts of amortization of DAC, and taxes. As noted in the preceding discussion,
certain hedge assets are used to hedge liabilities that are not carried at fair value and will not have a liability offset in the U.S. GAAP
sensitivity analysis. All sensitivities are measured as of year end and are related to the fair value of liabilities and hedge instruments in
place at that date for the Company’s variable annuity hedge programs. The impacts presented in the table that follows are estimated
individually and measured without consideration of any correlation among market risk factors.
GAAP Sensitivity Analysis As of December 31, 2015
(before tax and DAC) [1] GMWB Macro
Equity Market Return -20% -10% 10% -20% -10% 10%
Potential Net Fair Value Impact $ (19) $ (6) $ — $ 168 $ 70 $ (43)
Interest Rates -50bps -25bps +25bps -50bps -25bps +25bps
Potential Net Fair Value Impact $ 2 $ 1 $ (3) $ 12 $ 6 $ (6)
Implied Volatilities 10% 2% -10% 10% 2% -10%
Potential Net Fair Value Impact $ (50) $ (10) $ 48 $ 93 $ 19 $ (89)
[1] These sensitivities are based on the following key market levels as of December 31, 2015: 1) S&P of 2044; 2) 10yr US swap rate of 2.25%; and 3)
S&P 10yr volatility of 27.16%
The preceding sensitivity analysis is an estimate and should not be used to predict the future financial performance of the Company's
variable annuity hedge programs. The actual net changes in the fair value liability and the hedging assets illustrated in the preceding
table may vary materially depending on a variety of factors which include but are not limited to:
• The sensitivity analysis is only valid as of the measurement date and assumes instantaneous changes in the capital market
factors and no ability to rebalance hedge positions prior to the market changes;
• Changes to the underlying hedging program, policyholder behavior, and variation in underlying fund performance relative to
the hedged index, which could materially impact the liability; and
• The impact of elapsed time on liabilities or hedge assets, any non-parallel shifts in capital market factors, or correlated moves
across the sensitivities.
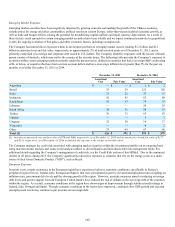
Foreign Currency Exchange Risk
Foreign currency exchange risk is defined as the risk of financial loss due to changes in the relative value between currencies. The
Company’s foreign currency exchange risk is related to non-U.S. dollar denominated investments, which primarily consist of fixed
maturity and equity investments, a yen denominated fixed payout annuity and changes in equity of a P&C runoff entity in the United
Kingdom. In addition, the Company’s Talcott Resolution operations formerly issued non-U.S. dollar denominated funding agreement
liability contracts. A significant portion of the Company’s foreign currency exposure is mitigated through the use of derivatives.
Fixed Maturity and Equity Investments
The risk associated with the non-U.S. dollar denominated fixed maturities and equities relates to potential decreases in value and income
resulting from unfavorable changes in foreign exchange rates. The fair values of the non-U.S. dollar denominated fixed maturities and
equities at December 31, 2015 and 2014 were approximately $921 and $549, respectively. Included in these amounts are $530 and $398
at December 31, 2015 and 2014, respectively, related to non-U.S. dollar denominated fixed maturity and equity securities that directly
support liabilities denominated in the same currencies. At December 31, 2015 and 2014, the derivatives used to hedge currency
exchange risk related to the remaining non-U.S. dollar denominated fixed maturities and equities had a total notional amount of $444
and $137, respectively, and total fair value of $18 and $2, respectively.
Based on the fair values of the Company’s non-U.S. dollar denominated securities and derivative instruments as of December 31, 2015
and 2014, management estimates that a 10% unfavorable change in exchange rates would decrease the fair values by a before-tax total of
approximately $48 and $38, respectively. The estimated impact was based upon a 10% change in December 31 spot rates. The selection
of the 10% unfavorable change was made only for illustration of the potential hypothetical impact of such an event and should not be
construed as a prediction of future market events. Actual results could differ materially from those illustrated above due to the nature of
the estimates and assumptions used in the analysis.