The Hartford 2015 Annual Report Download - page 112
Download and view the complete annual report
Please find page 112 of the 2015 The Hartford annual report below. You can navigate through the pages in the report by either clicking on the pages listed below, or by using the keyword search tool below to find specific information within the annual report.-
 1
1 -
2
-
3
-
4
-
5
-
6
-
7
-
8
-
9
-
10
-
11
-
12
-
13
-
14
-
15
-
16
-
17
-
18
-
19
-
20
-
21
-
22
-
23
-
24
-
25
-
26
-
27
-
28
-
29
-
30
-
31
-
32
-
33
-
34
-
35
-
36
-
37
-
38
-
39
-
40
-
41
-
42
-
43
-
44
-
45
-
46
-
47
-
48
-
49
-
50
-
51
-
52
-
53
-
54
-
55
-
56
-
57
-
58
-
59
-
60
-
61
-
62
-
63
-
64
-
65
-
66
-
67
-
68
-
69
-
70
-
71
-
72
-
73
-
74
-
75
-
76
-
77
-
78
-
79
-
80
-
81
-
82
-
83
-
84
-
85
-
86
-
87
-
88
-
89
-
90
-
91
-
92
-
93
-
94
-
95
-
96
-
97
-
98
-
99
-
100
-
101
-
 102
102 -
 103
103 -
 104
104 -
 105
105 -
 106
106 -
 107
107 -
 108
108 -
 109
109 -
 110
110 -
 111
111 -
 112
112 -
 113
113 -
 114
114 -
 115
115 -
 116
116 -
 117
117 -
 118
118 -
 119
119 -
 120
120 -
 121
121 -
 122
122 -
123
-
124
-
125
-
126
-
127
-
128
-
129
-
130
-
131
-
132
-
133
-
134
-
135
-
136
-
137
-
138
-
139
-
140
-
141
-
142
-
143
-
144
-
145
-
146
-
147
-
148
-
149
-
150
-
151
-
152
-
153
-
154
-
155
-
156
-
157
-
158
-
159
-
160
-
161
-
162
-
163
-
164
-
165
-
166
-
167
-
168
-
169
-
170
-
171
-
172
-
173
-
174
-
175
-
176
-
177
-
178
-
179
-
180
-
181
-
182
-
183
-
184
-
185
-
186
-
187
-
188
-
189
-
190
-
191
-
192
-
193
-
194
-
195
-
196
-
197
-
198
-
199
-
200
-
201
-
202
-
203
-
204
-
205
-
206
-
207
-
208
-
209
-
210
-
211
-
212
-
213
-
214
-
215
-
216
-
217
-
218
-
219
-
220
-
221
-
222
-
223
-
224
-
225
-
226
-
227
-
228
-
229
-
230
-
231
-
232
-
233
-
234
-
235
-
236
-
237
-
238
-
239
-
240
-
241
-
242
-
243
-
244
-
245
-
246
-
247
-
248
-
249
-
250
-
251
-
252
-
253
-
254
-
255
 |
 |

112
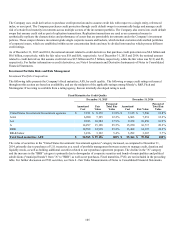
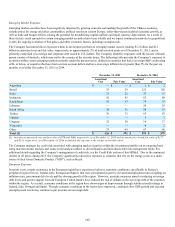
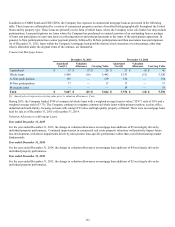
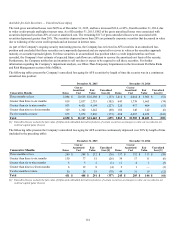
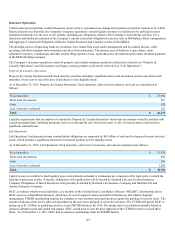
In addition to CMBS bonds and CRE CDOs, the Company has exposure to commercial mortgage loans as presented in the following
table. These loans are collateralized by a variety of commercial properties and are diversified both geographically throughout the United
States and by property type. These loans are primarily in the form of whole loans, where the Company is the sole lender, but may include
participations. Loan participations are loans where the Company has purchased or retained a portion of an outstanding loan or package
of loans and participates on a pro-rata basis in collecting interest and principal pursuant to the terms of the participation agreement. In
general, A-Note participations have senior payment priority, followed by B-Note participations and then mezzanine loan participations.
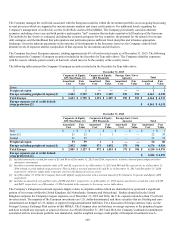
As of December 31, 2015, loans within the Company’s mortgage loan portfolio that have had extensions or restructurings, other than
what is allowable under the original terms of the contract, are immaterial.
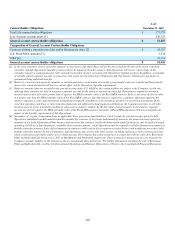
Commercial Mortgage Loans
December 31, 2015 December 31, 2014
Amortized
Cost [1] Valuation
Allowance Carrying Value Amortized
Cost [1] Valuation
Allowance Carrying Value
Agricultural $ 33 $ (7) $ 26 $ 51 $ (5) $ 46
Whole loans 5,458 (16) 5,442 5,333 (13) 5,320
A-Note participations 139 — 139 154 — 154
B-Note participations 17 — 17 17 — 17
Mezzanine loans — — — 19 — 19
Total $ 5,647 $ (23) $ 5,624 $ 5,574 $ (18) $ 5,556
[1] Amortized cost represents carrying value prior to valuation allowances, if any.
During 2015, the Company funded $744 of commercial whole loans with a weighted average loan-to-value (“LTV”) ratio of 63% and a
weighted average yield of 3.7%. The Company continues to originate commercial whole loans within primary markets, such as office,
industrial and multi-family, focusing on loans with strong LTV ratios and high quality property collateral. There were no mortgage loans
held for sale as of December 31, 2015 or December 31, 2014.
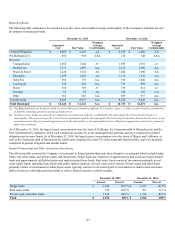
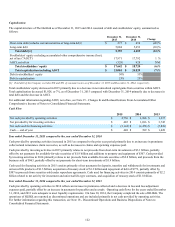
Valuation Allowances on Mortgage Loans
Year ended December 31, 2015
For the year ended December 31, 2015, the change in valuation allowances on mortgage loan additions of $5 was largely driven by
individual property performance. Continued improvement in commercial real estate property valuations will positively impact future
loss development, with future impairments driven by idiosyncratic loan-specific performance rather than overall deteriorating market
fundamentals.
Year ended December 31, 2014
For the year ended December 31, 2014, the change in valuation allowances on mortgage loan additions of $4 was largely driven by
individual property performance.
Year ended December 31, 2013
For the year ended December 31, 2013, the change in valuation allowances on mortgage loan additions of $2 was largely driven by
individual property performance.