The Hartford 2015 Annual Report Download - page 198
Download and view the complete annual report
Please find page 198 of the 2015 The Hartford annual report below. You can navigate through the pages in the report by either clicking on the pages listed below, or by using the keyword search tool below to find specific information within the annual report.-
 1
1 -
2
-
3
-
4
-
5
-
6
-
7
-
8
-
9
-
10
-
11
-
12
-
13
-
14
-
15
-
16
-
17
-
18
-
19
-
20
-
21
-
22
-
23
-
24
-
25
-
26
-
27
-
28
-
29
-
30
-
31
-
32
-
33
-
34
-
35
-
36
-
37
-
38
-
39
-
40
-
41
-
42
-
43
-
44
-
45
-
46
-
47
-
48
-
49
-
50
-
51
-
52
-
53
-
54
-
55
-
56
-
57
-
58
-
59
-
60
-
61
-
62
-
63
-
64
-
65
-
66
-
67
-
68
-
69
-
70
-
71
-
72
-
73
-
74
-
75
-
76
-
77
-
78
-
79
-
80
-
81
-
82
-
83
-
84
-
85
-
86
-
87
-
88
-
89
-
90
-
91
-
92
-
93
-
94
-
95
-
96
-
97
-
98
-
99
-
100
-
101
-
102
-
103
-
104
-
105
-
106
-
107
-
108
-
109
-
110
-
111
-
112
-
113
-
114
-
115
-
116
-
117
-
118
-
119
-
120
-
121
-
122
-
123
-
124
-
125
-
126
-
127
-
128
-
129
-
130
-
131
-
132
-
133
-
134
-
135
-
136
-
137
-
138
-
139
-
140
-
141
-
142
-
143
-
144
-
145
-
146
-
147
-
148
-
149
-
150
-
151
-
152
-
153
-
154
-
155
-
156
-
157
-
158
-
159
-
160
-
161
-
162
-
163
-
164
-
165
-
166
-
167
-
168
-
169
-
170
-
171
-
172
-
173
-
174
-
175
-
176
-
177
-
178
-
179
-
180
-
181
-
182
-
183
-
184
-
185
-
186
-
187
-
 188
188 -
 189
189 -
 190
190 -
 191
191 -
 192
192 -
 193
193 -
 194
194 -
 195
195 -
 196
196 -
 197
197 -
 198
198 -
 199
199 -
 200
200 -
 201
201 -
 202
202 -
 203
203 -
 204
204 -
 205
205 -
 206
206 -
 207
207 -
 208
208 -
209
-
210
-
211
-
212
-
213
-
214
-
215
-
216
-
217
-
218
-
219
-
220
-
221
-
222
-
223
-
224
-
225
-
226
-
227
-
228
-
229
-
230
-
231
-
232
-
233
-
234
-
235
-
236
-
237
-
238
-
239
-
240
-
241
-
242
-
243
-
244
-
245
-
246
-
247
-
248
-
249
-
250
-
251
-
252
-
253
-
254
-
255
 |
 |

Table of Contents THE HARTFORD FINANCIAL SERVICES GROUP, INC.
NOTES TO CONSOLIDATED FINANCIAL STATEMENTS (continued)
10. Reserves for Future Policy Benefits and Unpaid Losses and Loss Adjustment Expenses
F-67
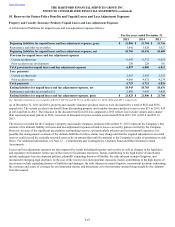
Property and Casualty Insurance Products Unpaid Losses and Loss Adjustment Expenses
A roll-forward of liabilities for unpaid losses and loss adjustment expenses follows:
For the years ended December 31,
2015 2014 2013
Beginning liabilities for unpaid losses and loss adjustment expenses, gross $ 21,806 $ 21,704 $ 21,716
Reinsurance and other recoverables 3,041 3,028 3,027
Beginning liabilities for unpaid losses and loss adjustment expenses, net 18,765 18,676 18,689
Provision for unpaid losses and loss adjustment expenses
Current accident year 6,647 6,572 6,621
Prior accident year development 250 228 192
Total provision for unpaid losses and loss adjustment expenses 6,897 6,800 6,813
Less: payments
Current accident year 2,653 2,639 2,552
Prior accident years 4,066 4,072 4,274
Total payments 6,719 6,711 6,826
Ending liabilities for unpaid losses and loss adjustment expenses, net 18,943 18,765 18,676
Reinsurance and other recoverables [1] 2,882 3,041 3,028
Ending liabilities for unpaid losses and loss adjustment expenses, gross $ 21,825 $ 21,806 $ 21,704
[1] Includes reinsurance recoverables of $2,515, $2,730 and $2,735 as of December 31, 2015, 2014 and 2013, respectively.
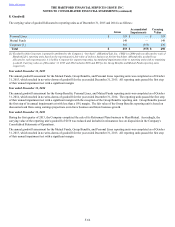
As of December 31, 2015 and 2014, property and casualty insurance products reserves were discounted by a total of $523 and $556,
respectively. The current accident year benefit from discounting property and casualty insurance products reserves was $35 in 2015, $34
in 2014 and $46 in 2013. The reduction in the discount benefit in 2014 as compared to 2013 reflects lower claim volume and a shorter
than expected payment pattern in 2014. Accretion of discounts for prior accident years totaled $38 in 2015, $31 in 2014, and $31 in
2013.
The reserves recorded for the Company’s property and casualty insurance products at December 31, 2015 represent the Company’s best
estimate of its ultimate liability for losses and loss adjustment expenses related to losses covered by policies written by the Company.
However, because of the significant uncertainties surrounding reserves, and particularly asbestos and environmental exposures, it is
possible that management’s estimate of the ultimate liabilities for these claims may change and that the required adjustment to recorded
reserves could exceed the currently recorded reserves by an amount that could be material to the Company’s results of operations or cash
flows. For additional information, see Note 12 - Commitments and Contingencies, Guaranty Fund and Other Insurance-related
Assessments.
Losses and loss adjustment expenses are also impacted by trends including frequency and severity as well as changes in the legislative
and regulatory environment. In the case of the reserves for asbestos exposures, factors contributing to the high degree of uncertainty
include inadequate loss development patterns, plaintiffs’ expanding theories of liability, the risks inherent in major litigation, and
inconsistent emerging legal doctrines. In the case of the reserves for environmental exposures, factors contributing to the high degree of
uncertainty include expanding theories of liabilities and damages, the risks inherent in major litigation, inconsistent decisions concerning
the existence and scope of coverage for environmental claims, and uncertainty as to the monetary amount being sought by the claimant
from the insured.