The Hartford 2015 Annual Report Download - page 227
Download and view the complete annual report
Please find page 227 of the 2015 The Hartford annual report below. You can navigate through the pages in the report by either clicking on the pages listed below, or by using the keyword search tool below to find specific information within the annual report.-
 1
1 -
2
-
3
-
4
-
5
-
6
-
7
-
8
-
9
-
10
-
11
-
12
-
13
-
14
-
15
-
16
-
17
-
18
-
19
-
20
-
21
-
22
-
23
-
24
-
25
-
26
-
27
-
28
-
29
-
30
-
31
-
32
-
33
-
34
-
35
-
36
-
37
-
38
-
39
-
40
-
41
-
42
-
43
-
44
-
45
-
46
-
47
-
48
-
49
-
50
-
51
-
52
-
53
-
54
-
55
-
56
-
57
-
58
-
59
-
60
-
61
-
62
-
63
-
64
-
65
-
66
-
67
-
68
-
69
-
70
-
71
-
72
-
73
-
74
-
75
-
76
-
77
-
78
-
79
-
80
-
81
-
82
-
83
-
84
-
85
-
86
-
87
-
88
-
89
-
90
-
91
-
92
-
93
-
94
-
95
-
96
-
97
-
98
-
99
-
100
-
101
-
102
-
103
-
104
-
105
-
106
-
107
-
108
-
109
-
110
-
111
-
112
-
113
-
114
-
115
-
116
-
117
-
118
-
119
-
120
-
121
-
122
-
123
-
124
-
125
-
126
-
127
-
128
-
129
-
130
-
131
-
132
-
133
-
134
-
135
-
136
-
137
-
138
-
139
-
140
-
141
-
142
-
143
-
144
-
145
-
146
-
147
-
148
-
149
-
150
-
151
-
152
-
153
-
154
-
155
-
156
-
157
-
158
-
159
-
160
-
161
-
162
-
163
-
164
-
165
-
166
-
167
-
168
-
169
-
170
-
171
-
172
-
173
-
174
-
175
-
176
-
177
-
178
-
179
-
180
-
181
-
182
-
183
-
184
-
185
-
186
-
187
-
188
-
189
-
190
-
191
-
192
-
193
-
194
-
195
-
196
-
197
-
198
-
199
-
200
-
201
-
202
-
203
-
204
-
205
-
206
-
207
-
208
-
209
-
210
-
211
-
212
-
213
-
214
-
215
-
216
-
 217
217 -
 218
218 -
 219
219 -
 220
220 -
 221
221 -
 222
222 -
 223
223 -
 224
224 -
 225
225 -
 226
226 -
 227
227 -
 228
228 -
 229
229 -
 230
230 -
 231
231 -
 232
232 -
 233
233 -
 234
234 -
 235
235 -
 236
236 -
 237
237 -
238
-
239
-
240
-
241
-
242
-
243
-
244
-
245
-
246
-
247
-
248
-
249
-
250
-
251
-
252
-
253
-
254
-
255
 |
 |

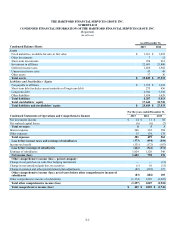
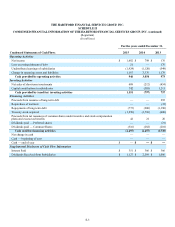
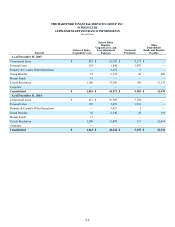
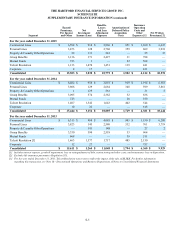
Table of Contents THE HARTFORD FINANCIAL SERVICES GROUP, INC.
NOTES TO CONSOLIDATED FINANCIAL STATEMENTS (continued)
17. Stock Compensation Plans (continued)
F-96
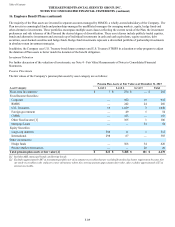
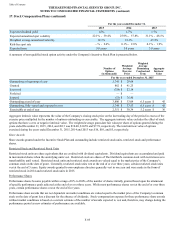
Other performance share awards or portions thereof have a market condition based upon the Company's total shareholder return relative
to a group of peer companies within a three year period. Stock compensation expense for these performance share awards is based on
the number of awards expected to vest as estimated at the grant date and therefore does not change for changes in estimated
performance. The Company uses a risk neutral Monte-Carlo valuation model that incorporates time to maturity, implied volatilities of
the Company and the peer companies, and correlations between the Company and the peer companies and interest rates. The range for
assumptions of inputs are disclosed below.
For the years ended December 31,
2015 2014 2013
Volatility of common stock 21.4% 31.6% 42.8%
Average volatility of peer companies 14.0% - 24.0% 17.0% - 29.0% 20.0% - 36.0%
Average correlation coefficient of peer companies 54.0% 62.0% 76.0%
Risk-free spot rate 1.1% 0.7% 0.4%
Term 3.0 years 3.0 years 3.0 years
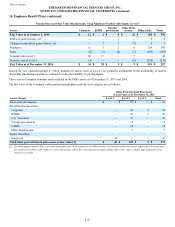
Total Share Awards
A summary of non-vested share award activity under the Company's Incentive Stock Plan is presented below.
Restricted Stock and
Restricted Stock Units Performance Shares
Number of
Shares
(in thousands)
Weighted-Average
Grant-Date
Fair Value
Number of
Shares
(in thousands)
Weighted-Average
Grant date
Fair Value
Non-vested shares For the year ended December 31, 2015
Non-vested at beginning of year 7,232 $ 26.59 1,063 $ 30.55
Granted 1,603 $ 42.25 398 $ 42.40
Performance based adjustment 407 $ 24.15
Vested (2,708) $ 20.95 (814) $ 24.15
Forfeited (259) $ 36.90 (279) $ 33.47
Non-vested at end of year 5,868 $ 33.12 775 $ 37.35
The weighted average grant-date fair value per share of restricted stock units and restricted stock granted during the years ended
December 31, 2015, 2014, and 2013 was $42.25, $35.74 and $27.72, respectively. The weighted average grant-date fair value per share
of performance shares granted during the years ended December 31, 2015, 2014, and 2013 was $42.40, $36.45 and $27.92, respectively.
The total fair value of shares vested during the years ended December 31, 2015, 2014 and 2013 was $144, $75 and $42, respectively,
based on actual or estimated performance factors. The Company did not make cash payments in settlement of stock compensation during
the years ended December 31, 2015, 2014 and 2013.
Subsidiary Stock Plan
In 2013 the Company established a subsidiary stock-based compensation plan similar to The Hartford Incentive Stock Plan except that it
awards non-public subsidiary stock as compensation. The Company recognized stock-based compensation plans expense of $7, $4 and
$1 in the years ended December 31, 2015, 2014 and 2013, respectively, for the subsidiary stock plan. Upon employee vesting of
subsidiary stock, the Company will recognize a noncontrolling equity interest. Employees will be restricted from selling vested
subsidiary stock to other than the Company and the Company will have discretion on the amount of stock to repurchase. Therefore the
subsidiary stock is classified as equity because it is not mandatorily redeemable.
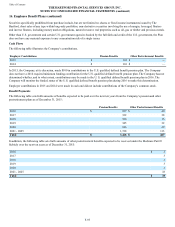
Employee Stock Purchase Plan
The Company sponsors The Hartford Employee Stock Purchase Plan (“ESPP”). Under this plan, eligible employees of The Hartford
purchase common stock of the Company at a discount rate of 5% of the market price per share on the last trading day of the offering
period. Accordingly, the plan is a noncompensatory plan. Employees purchase a variable number of shares of stock through payroll
deductions elected as of the beginning of the offering period. The Company may sell up to 15,400,000 shares of stock to eligible
employees under the ESPP. As of December 31, 2015, there were 4,944,278 shares available for future issuance. During the years ended
December 31, 2015, 2014 and 2013, 249,344 shares, 258,609 shares, and 321,723 shares were sold, respectively. The weighted average
per share fair value of the discount under the ESPP was $2.15, $1.70 and $1.00 during the years ended December 31, 2015, 2014 and
2013, respectively. The fair value is estimated based on the 5% discount off the market price per share on the last trading day of the
offering period.